

Annual Integrated Report


Holistic approach to value creation, blending financial and non-financial performance
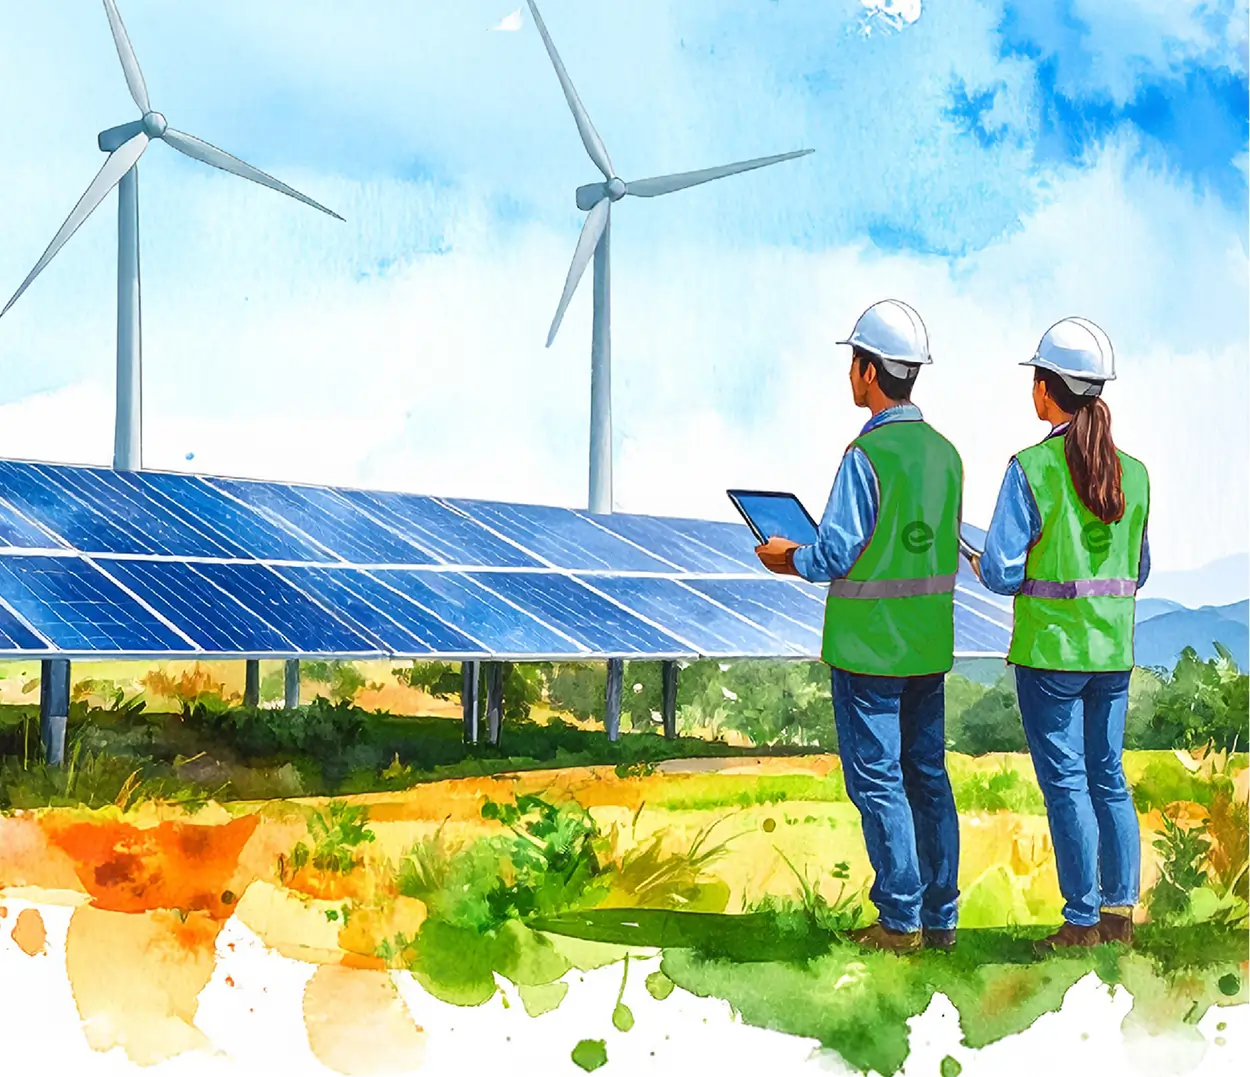
Building a carbon-free world through holistic solutions


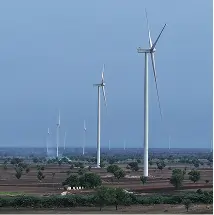
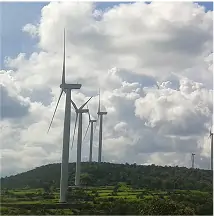
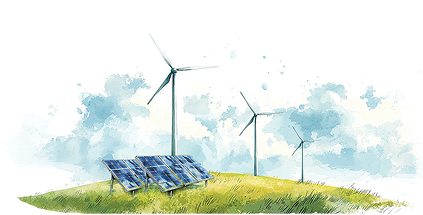
Harnessing wind energy to power a sustainable future
commissioned and installed capacity
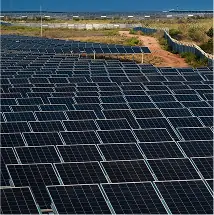
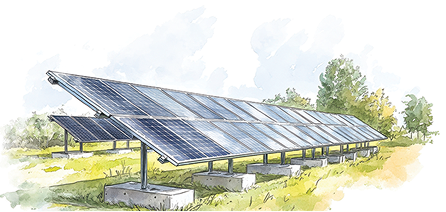
Capturing solar energy to accelerate the green energy transition
commissioned and installed capacity
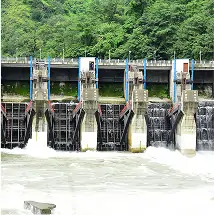
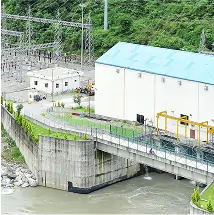
Turning the flow of water into a force for sustainable energy
installed capacity
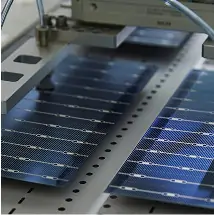
Next-Gen Solar: Advancing Solar Cell & Module Manufacturing
module & cell capacity respectively
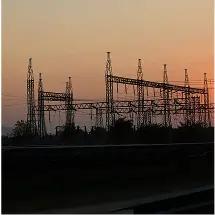
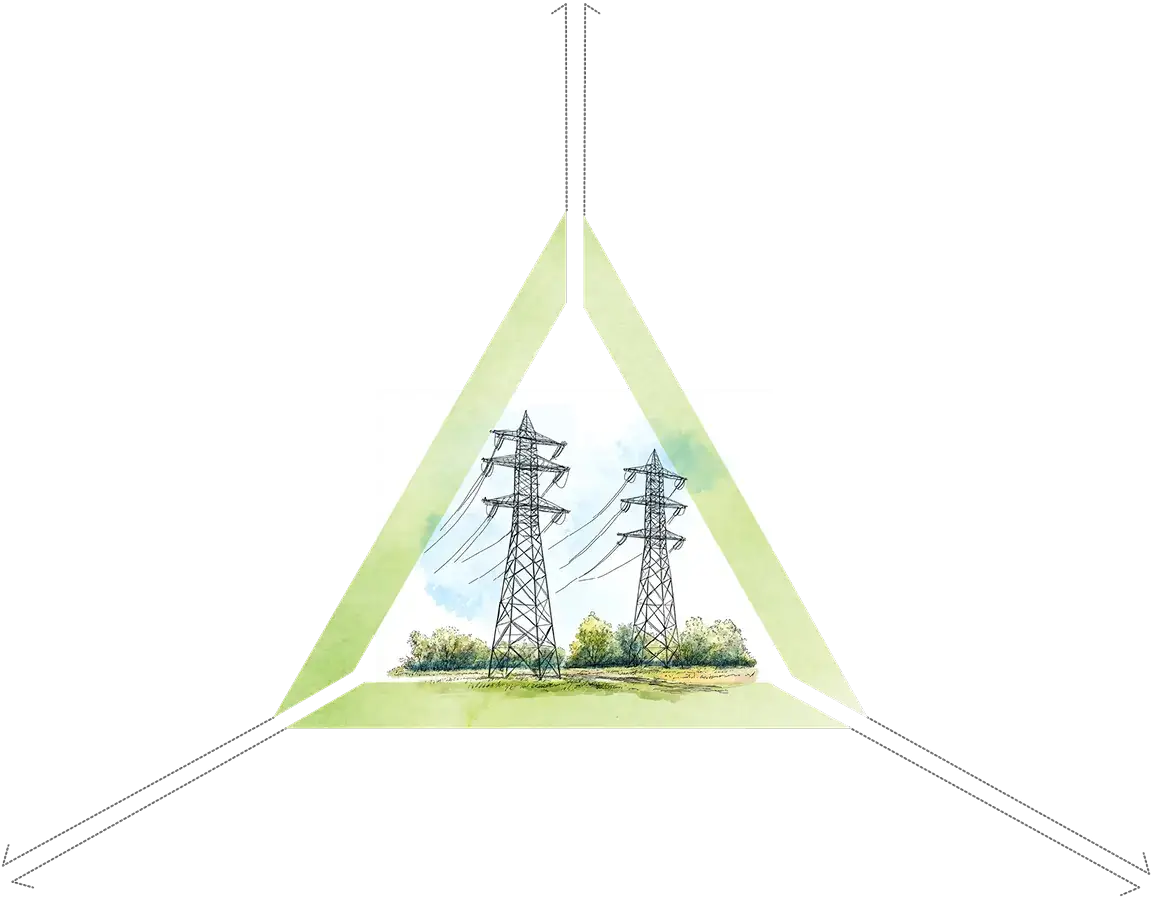
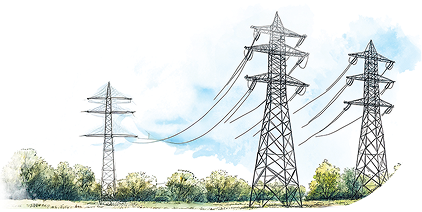
Efficient and reliable energy transmission for the future
Transmission capacity

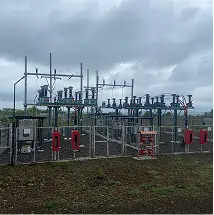
Ensuring seamless and uninterrupted power supply
RTC complex project
Enabling Businesses to Lead the Clean Energy Transition
renewable energy supply
The Currency of a Greener Future
carbon credits generated
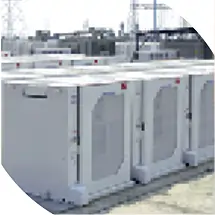
Optimising Energy Efficiency with Smart Management Solutions
of clean energy managed
Bridging the Gap Between Generation and Demand
Peak Power Project
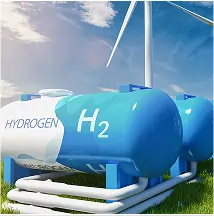
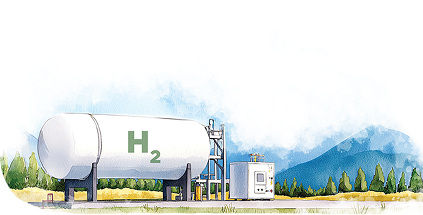
The Next Chapter in Clean Energy Innovation
development pipeline for cumulative green ammonia and methanol projects
Key Performance Highlights FY 2024-25

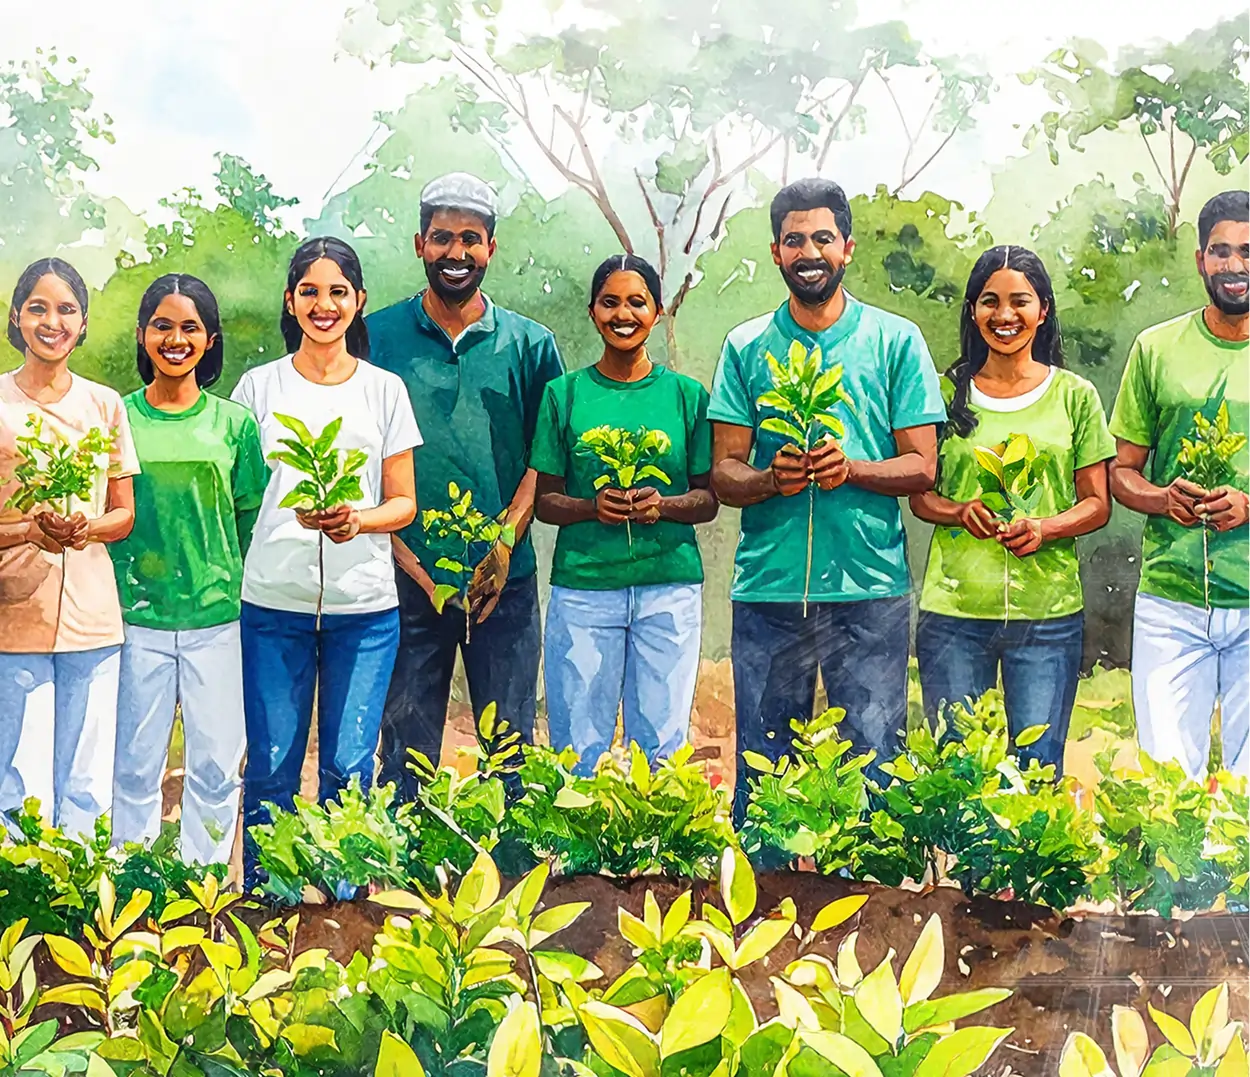
lives positively impacted through Corporate Social Responsibility (CSR) Interventions
of clean electricity generated, enough to power over 6 million Indian households annually
only Indian energy utility company to be featured in the prestigious list
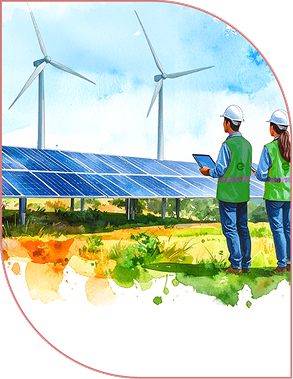
portfolio spanning solar, wind, hydro, and emerging technologies
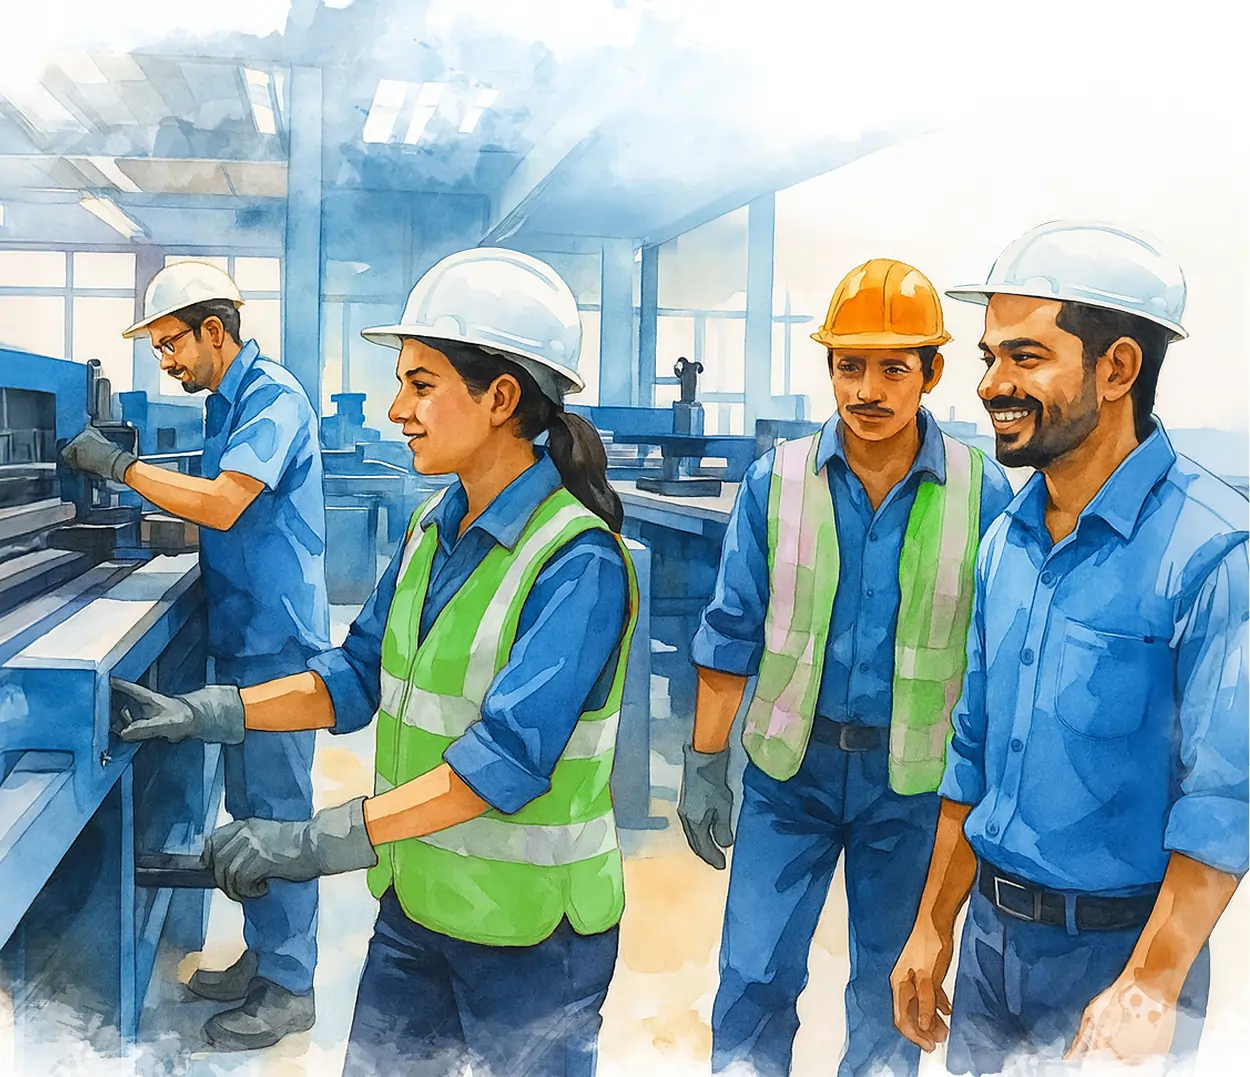
dedicated employees and workers in the workforce
of India’s Total Renewable Energy Generated
Profit After Tax (PAT)
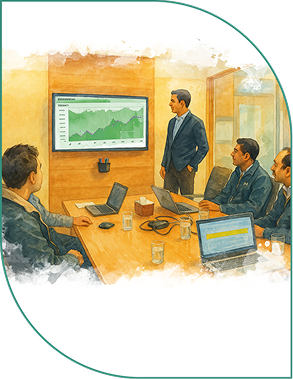
Dear Stakeholders,
As we strive to create a Net Zero world, this report captures how we are accelerating clean energy solutions and pushing the boundaries of innovation. It highlights the progress we are making towards our 2040 Net Zero journey focused on clean energy, communities and climate action.
Dear Stakeholders,
This fiscal year was marked by significant operational and sustainability milestones, reinforcing our commitment to India’s clean energy transition. Looking forward, our focus is on scaling this momentum through enhanced transparency, robust disclosures, and data-driven decision-making.
ReNew’s Sustainability Targets to Responsible Transformation
We are present across 10 Indian states, with a diversified asset portfolio that supports energy access, grid stability, and just transition.


Rajasthan
Madhya Pradesh
Gujarat
Andhra Pradesh
Maharashtra
Karnataka
Telangana
Uttarakhand
Tamil Nadu
Corporate Office
Total commissioned:
Total committed capacity:
Total Manufacturing Capacity
Dear Stakeholders,
As we move into FY 2025–26, ReNew remains steadfast in its commitment to accelerating India’s clean energy transition through disciplined financial execution, technological innovation, and portfolio diversification. With continued profitability, strengthened capital recycling, and the strategic expansion of our commissioned capacity, we are well-positioned to meet the rising demand for reliable, low-carbon energy.
Dear Stakeholders,
At ReNew, sustainability is more than a commitment, it drives innovation, growth, and leadership. The Company’s sustainability-led business strategy creates enduring value and catalyses India’s clean energy transition through an inclusive and responsible business.
Our GHG Inventory for FY 2024-25
Learn About Our Decarbonisation StrategyPetrol
Diesel
LPG
Refrigerants
Process Emissions + Fire Extinguisher
Total electricity generation
22,185,432 MWh
Electricity purchased from grid
Total avoided emissions
18,657,949 MWh
Employee Commute
Capital goods
Business Travel
Purchased goods and services
Waste generated from operation
Fuel and Energy related activities
Upstream transportation and distribution
At ReNew, materiality assessment is fundamental to our approach to crafting a responsive and responsible business strategy
Learn MoreHigh
financial materiality
|
Compliance Management 7
|
Climate Change 2
|
Business Ethics 1
|
||||
|
Risk Management 9
|
Energy Management 10
|
Innovation &
Digitisation 8
Sustainable Supply
Chain 11
|
Policy Advocacy & Thought
Leadership 3
Health & Safety 4
Employee Engagement &
Development 5
|
|||
|
Waste Management 13
|
Human Rights 12
|
Community Engagement 6
|
||||
|
Water Management 14
Biodiversity
Conservation 15
|
||||||
|
Diversity & Inclusion
16
|
||||||
|
GHG Management 17
|
MEDIUM
impact materiality
High
Business Ethics
Climate Change
Policy Advocacy & Thought Leadership
Compliance Management
Innovation & Digitisation
Risk Management
Energy Management
Human Rights
Waste Management
Water Management
Biodiversity Conservation
Diversity & Inclusion
Our Bussiness Models

Communities
Investors
Customers &
Government Agencies
Communities
Employees
Suppliers
Investors
Employees
Investors
Communities
Customers
Suppliers
Employees
Investors
Customers &
Government Agencies
Investors
Shareholders


Communities
Investors
Customers &
Government Agencies
Communities
Employees
Suppliers
Investors
Employees
Investors
Communities
Customers
Suppliers
Employees
Investors
Customers &
Government Agencies
Investors
Shareholders


Our Capitals
Shaping the Future of Energy
billion kWh of clean electricity generated, powering more than 6 million Indian households annually
of solar modules and 2.5 GW of solar cells manufacturing capacity
of transmission lines constructed, 103% increase in transmission infrastructure
Shaping the Future of Energy
dedicated employees and workers in the workforce, ~16% Gender Diversity Rate
hours dedicated to learning and development activities, with a 46% increase in training spent
Lost Time Injury Frequency Rate (LTIFR), a 5% YoY reduction
Shaping the Future of Energy
reduction in Scope 1 & 2 emissions from baseline (SBTi-aligned)
electricity sourced from renewables, successfully surpassing our target of 50% by 2025
of water saved via robotic cleaning
Shaping the Future of Energy
lives positively impacted as of FY 2024-25, covering 11 states, 740+ villages, and 6 aspirational districts
critical suppliers assessed against detailed ESG criteria
increase from FY 2022-23 in revenue reported from corporate PPAs, with more than ~51% client base from high-impact sectors
Shaping the Future of Energy
total amount spent on R&D
Reported reduction in asset downtime and 1-1.5% increase in annual productivity
cases of data breaches reported
Shaping the Future of Energy
Total income and adjusted EBITDA of INR 79.2 Billion
Raised in green bonds and sustainable finance mechanisms till date
Total income from external sales from our module and cell manufacturing operations
(i) Our ever-expanding portfolio of diverse clean energy solutions requires a strong and skilled workforce in action. In the last three years, we have reported 6,400+ total new hires.
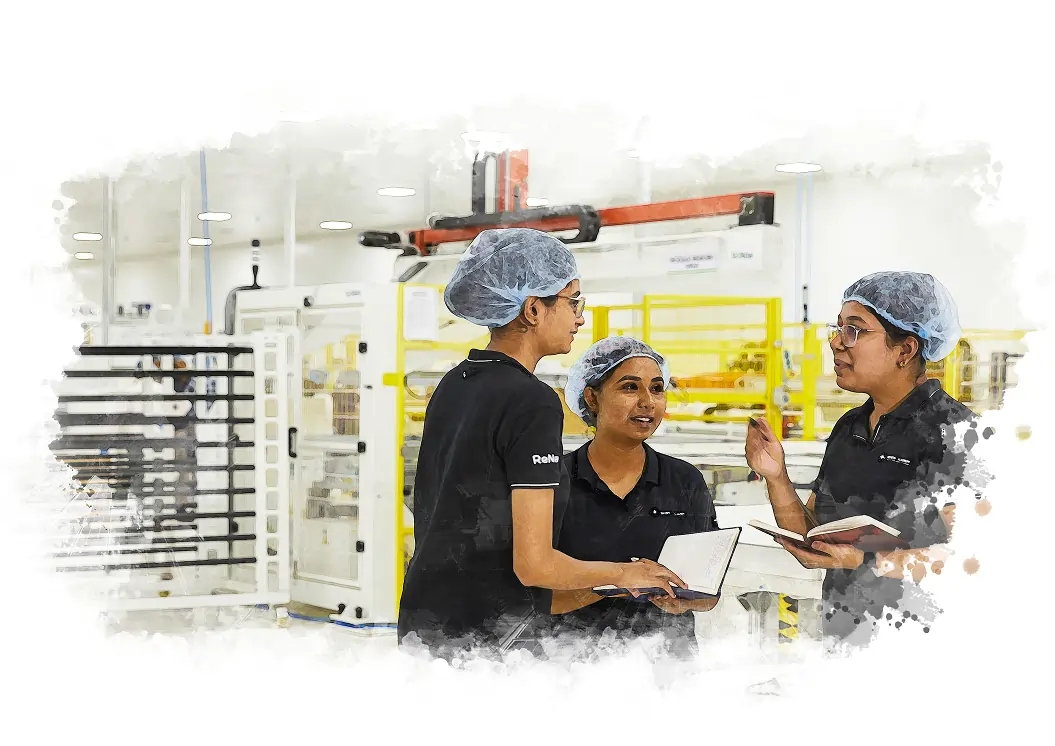
(ii) In FY 2024-25, we commenced a fully women-led post-lamination line at our Jaipur module manufacturing plant. The line is now fully operational with 77 women running all three shifts, successfully meeting our ReSTART target.
(i) Through our commissioned portfolio of 10.7 GW, we have generated 22+ billion kWh of clean electricity, thereby avoiding 18.6+ million tCO2e of emissions annually.
(ii) Our manufacturing facilities in Jaipur and Dholera have attained LEED GOLD certification. Additionally, for our Jaipur- manufactured solar module, we carried out a life cycle assessment, and published a verified Environment Product Declaration (EPD) Report.
(i) Our focus on strengthening manufactured capital has been a key enabler of innovation and digital transformation. By investing in advanced infrastructure and operational efficiency, we have accelerated R&D efforts and investments that reduce asset downtime, enhance annual energy yield, and enable real-time and predictive monitoring.
(i) Optimised plant load factors, 24.4% across wind and ~24% across solar assets, respectively, have enabled us to generate 22+ billion kWh of electricity annually, directly driving INR 79,348 million revenue in FY 2024-25.
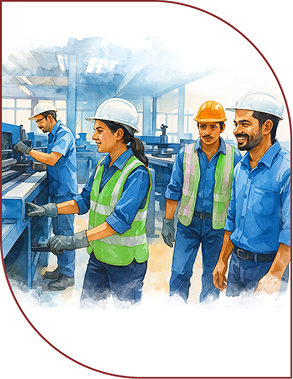
(i) Our utmost commitment to safety ensures a safe and secure conduct of operations across our sites. Maintaining utmost safety standards, ReNew’s Gadag Transmission Limited was recognised with Distinction in British Safety Council International Safety Award. Our Hydro plant was awarded British Sword of Honor, the first of its kind, globally. Our LTIFR has consitently declined in the last three years, with 0.21 LTIFR and 0 fatalities recorded in FY 2024-25.
(ii) In FY 2024-25, we introduced 13 specialised training programs, with 90% delivered at site locations. Additionally, our campus excellence programs are building a strong talent pipeline.
(i) To ensure meaningful employee participation in furthering our sustainability goals and targets, we offer structured ESG sensitisation programs to our employees. In FY 2024-25, ~90% of employees completed ESG training. Additionally, through our Climate Champions program, we tap into the passion of employees who voluntarily step forward to promote sustainability.
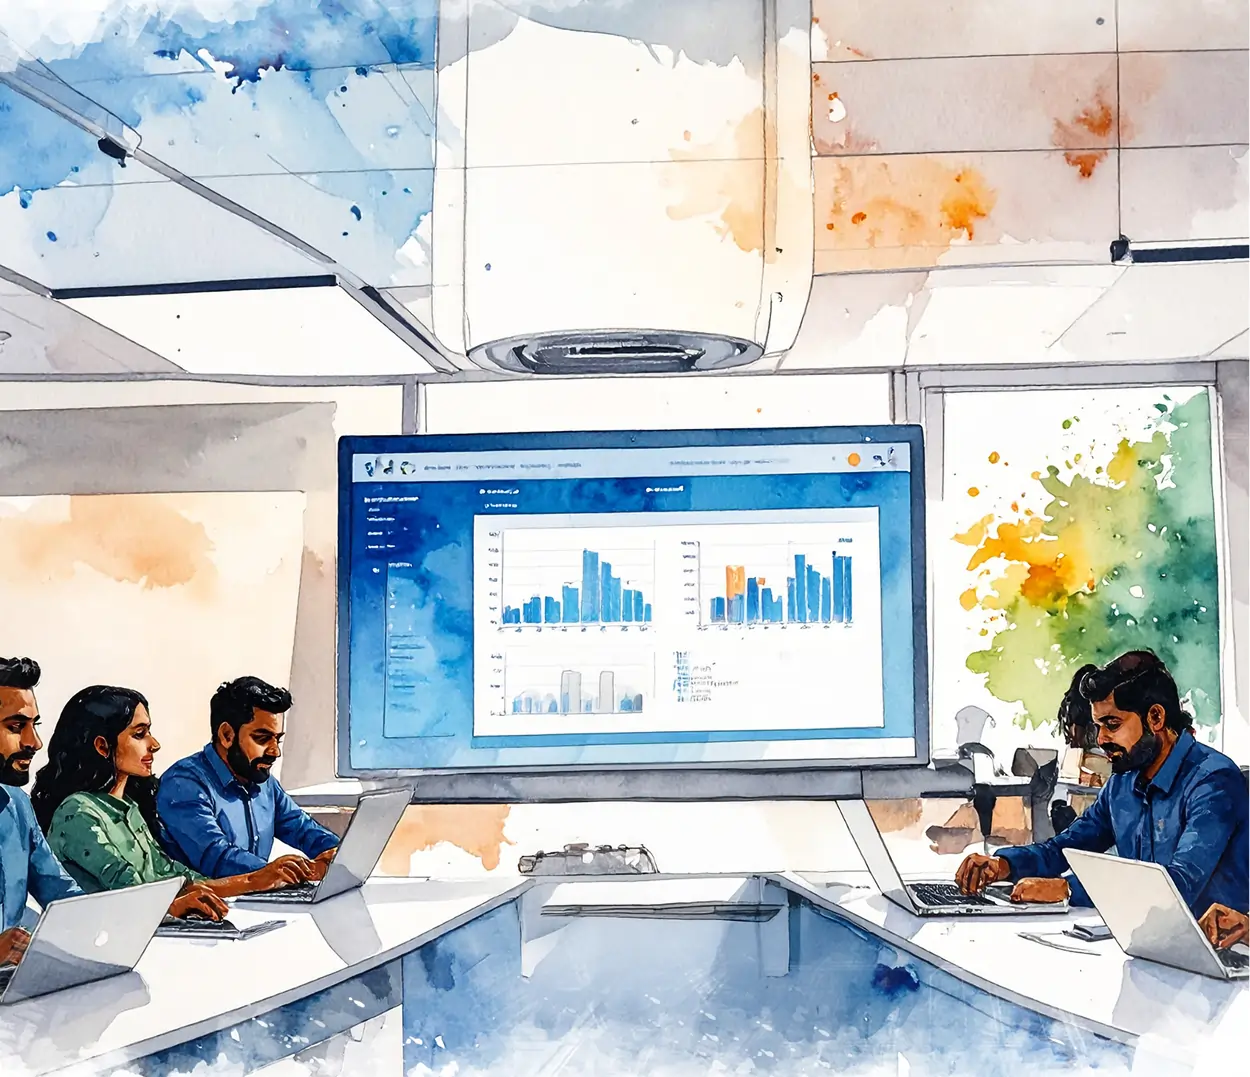
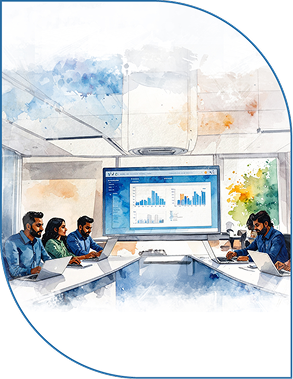
(i) ReNew Digital Lab (ReD Lab) drives operational excellence across our renewable energy portfolio. As an agile, people-centric innovation hub, it is led by Scrum Masters and supported by domain experts from business and engineering. The cross- functional team collaborates closely with site teams, while a central unit ensures alignment with state leads and site managers.
(i) Through an increase in employee satisfaction and successfully filling 55 of open positions via internal hiring, we have significantly reduced onboarding costs by 8%. This not only reflects a more engaged and motivated workforce but also highlights the effectiveness of our talent development strategy.
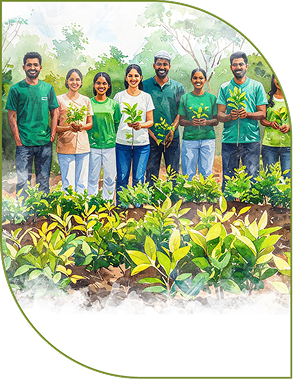
(i) We integrated nature and climate risk assessments into business decisions by conducting our first TNFD assessment and updating our climate risk assessment in line with IFRS S2. To address nature-related dependencies and impacts, we developed biodiversity baselines for two sites and formulated a comprehensive Biodiversity Management Plan.
(i) Through our understanding of climate-related risks, such as extreme heat, storms, and flooding, we are more informed to design safety measures that protect field technicians, plant operators, and other frontline staff working in dynamic environments.
(i) By prioritising the responsible use of natural capital, we have enabled the development of Digital Twin technology, virtual replicas that enhance real-time decision-making, reduce resource consumption, and minimise emissions and waste.
(i) A third-party energy audit at our Jaipur facility identified 11 energy- saving opportunities. Implementing these is expected to save INR 39.5 million annually, reduce electricity cost per module by ~20%, and cut annual electricity use by 19%, delivering both financial and environmental benefits
(i) At Koppal, Karnataka, we commissioned our first ISTS- connected 300 MW hybrid renewable facility. The project reflects our technical expertise, regulatory insight, and collaborative approach overcoming complex challenges to deliver dispatchable, round-the-clock renewable power.
(i) Leveraging our technical expertise, ReNew Project Surya trains women salt pan farmers in the Little Rann of Kutch as renewable energy technicians. So far, 575 women have been empowered, with some joining our long-term talent pipeline at manufacturing sites - advancing gender inclusion and breaking stereotypes in the sector.
(i) Through our corporate PPAs, we empower India’s private sector in meeting their climate goals, serving 80 clients - 37% of whom are Net Zero committed. In FY 2024–25, we delivered 2.84 billion units of RE through corporate PPAs, abating an estimated 2.38 million tCO2e.
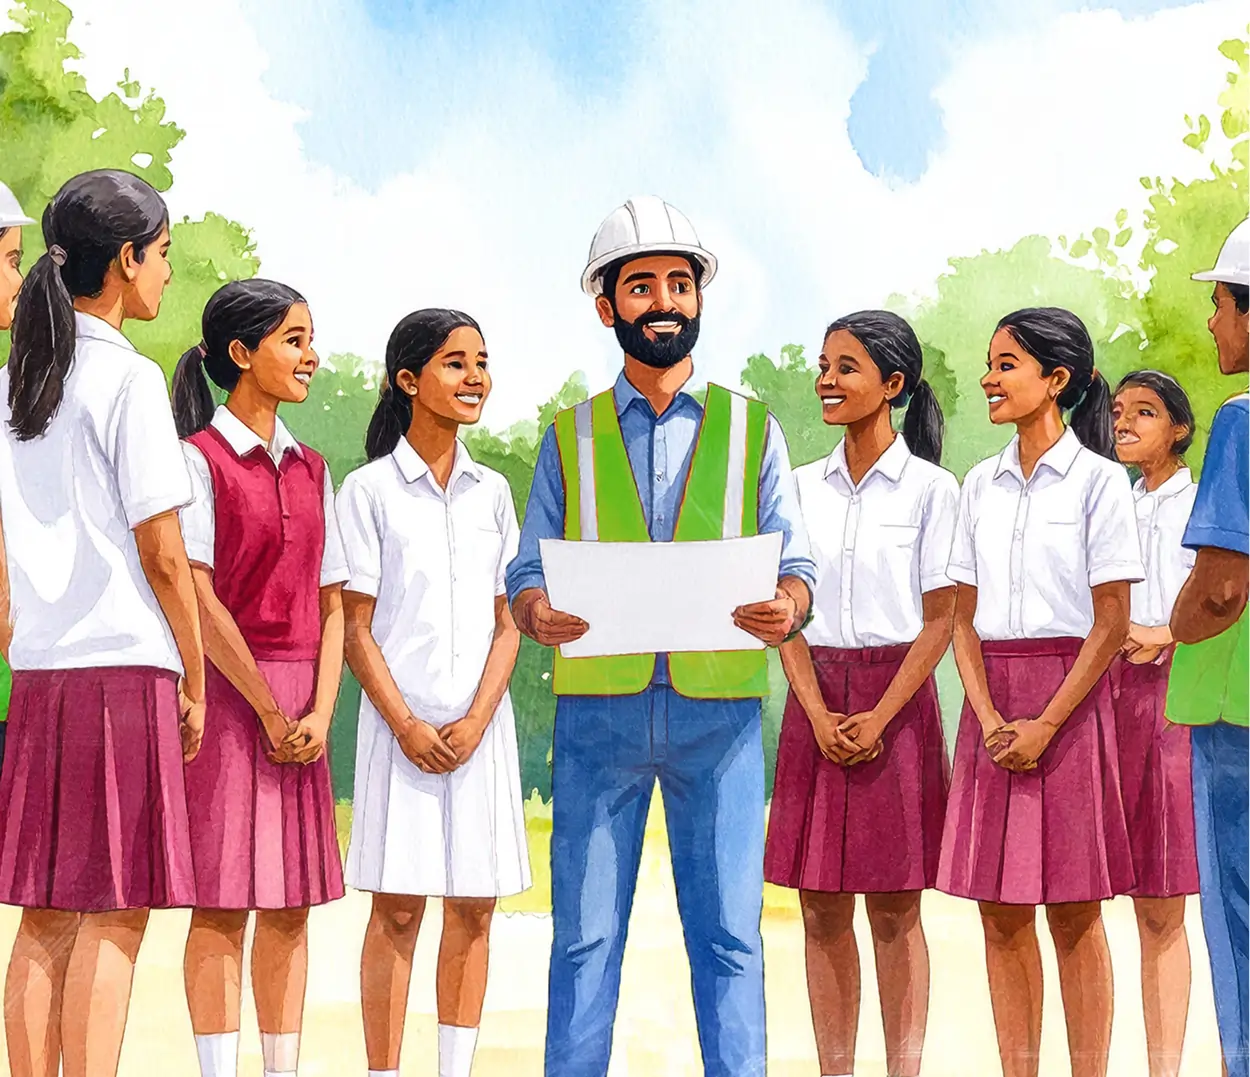
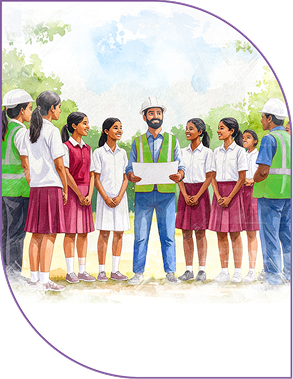
(ii) Our CSR interventions drive societal upliftment with an environmental focus. Our Lighting Lives program aims to achieve last-mile electrification of schools through solar power. Additionally, our Young Climate Leaders Curriculum, modelled around the core principles of the Lifestyle for the Environment (LiFE) Movement, empowers students to take meaningful action toward climate change.
(i) Strategic collaborations and strong business relationships are positioning us as frontrunners in the renewable energy sector. We are also focusing on integrating global battery energy storage systems (BESS) in India, addressing intermittency and enhancing reliability. Coupled with hybrid wind-solar plants, these systems enable stable, round-the-clock renewable power.
(i) Our strong market presence in the C&I segment has led to a notable increase in our revenues, with a 69% increase in the last two years. In FY 2024-25, we reported INR 11.55 billion from corporate PPAs, a 16% YoY growth.
(ii) Through a targeted CSR investment of INR 39 million, we are working for the benefit of 6 aspirational districts.
(i) Our Integrated Asset Management tool enabled real-time monitoring, predictive maintenance, and performance optimisation across wind assets, leading to a 26% reduction in asset downtime and a 1–1.5% improvement in energy yield.
(i) We leverage technology to boost safety and efficiency, using drones and automated grass-cutting machines to reduce manual risks. SCADA systems and platforms like Gensuite enable real-time monitoring and streamlined EHS workflows, enhancing performance and minimising hazards.
(i) Since FY 2021–22, we have gradually scaled up robotic cleaning at our solar plants. In FY 2024–25, deployment at 44 sites saved 436,175 m3 of water.
(ii) AI-powered blade inspections at wind sites enabled a 59% reduction in non-degradable waste by improving precision and minimising material use.
(i) Our digital interventions have resulted in an additional revenue of INR 710 million in FY 2024-25 and a ~40% improvement in return on R&D investment.
(ii) Automated power scheduling and real-time market intelligence enabled optimised power dispatch and reduced penalties, driving operational efficiencies and cost savings of INR 150 million.
(i) Secured an investment of USD 100 million from BII to boost our solar cell and module manufacturing facilities.
(i) ReNew allocated INR 58.5 million to L&D initiatives in FY 2024–25 - a 46% YoY increase enabling 792,638 hours of learning across areas like skill development, sustainability, health and safety, and business ethics.
(i) In FY 2024–25, we invested INR 131 million on environmental initiatives, including emissions, waste, water, biodiversity and product stewardship.
(i) With an investment of INR 97 million in R&D, ReNew underscores its commitment to pioneering digital solutions that enhance performance and sustainability.
Gender representation in manufacturing has long been constrained by perceptions around physical demands and skill suitability, often limiting opportunities for women in plant operations.
Read More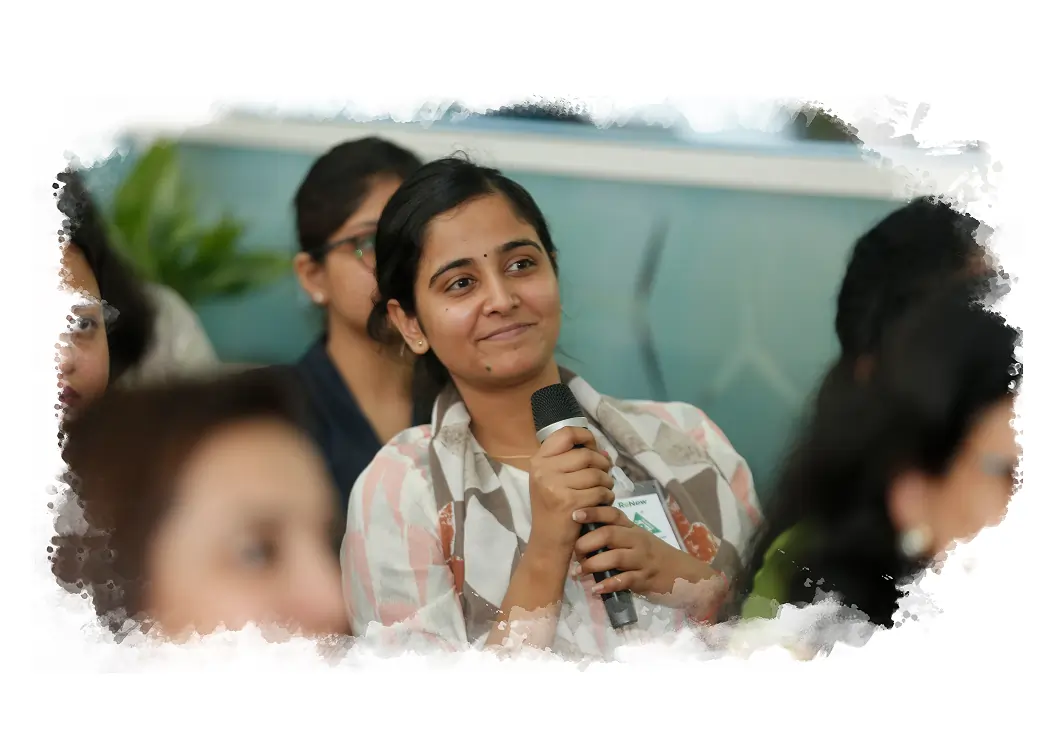
The W-Leaders Program is a targeted leadership development initiative for high-potential women leaders at ReNew handling senior management positions. Through multiple personalised one on one mentoring sessions with seasoned external facilitators, the program focuses on unlocking leadership potential and enabling long-term career advancement for women.
Read More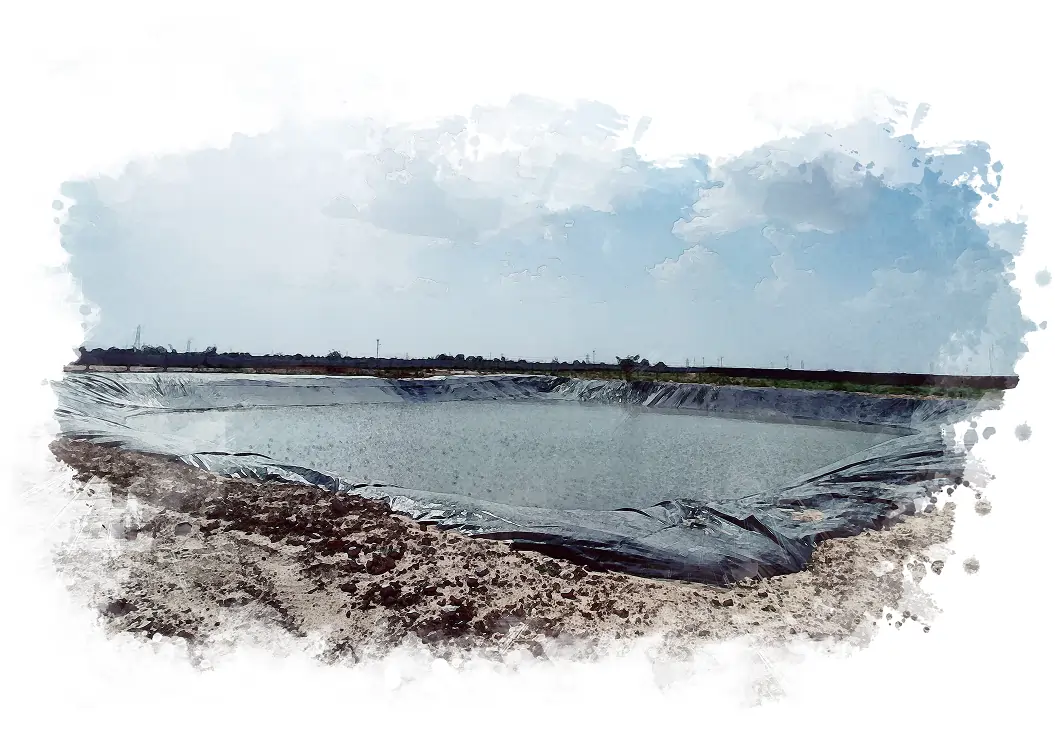
At ReNew, we are embedding water resilience into our operations while pioneering sustainable water management practices. In collaboration with the CII Water Institute, we have initiated a structured certification process, piloted at our Lahori Wind and Ashok Nagar Solar sites in Madhya Pradesh, aligning with the National Institution for Transforming India (NITI) Aayog’s Report on Water Neutrality for Indian Industry.
Read More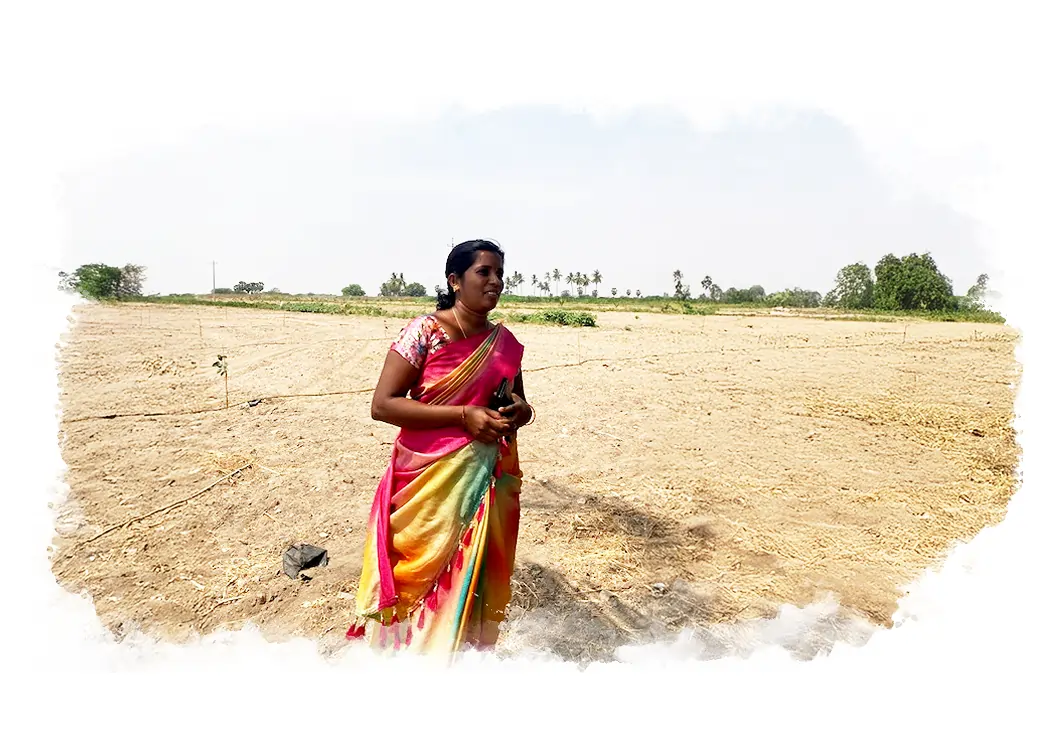
ReNew identified a crisis affecting over 1,000 smallholder farming families in the drought-prone regions of Andhra Pradesh and Maharashtra. Erratic weather patterns, land degradation, and falling groundwater tables had trapped these communities in cycles of debt and declining productivity.
Read More
Explore answers to common questions about ReNew’s Annual Integrated Report, covering key highlights, ESG standards, reporting frameworks, and more.
An integrated report combines a company’s financial performance with non-financial data such as environmental, social, and governance (ESG) metrics to provide a holistic overview of value creation.
Integrated reporting allows stakeholders to understand how our company’s sustainable practices and business strategy create long-term value for investors, communities, and the environment.
Key metrics cover carbon emissions, renewable energy generation, resource efficiency, community projects, and progress on the United Nations Sustainable Development Goals (SDGs).
ReNew is a leading decarbonization solutions company listed on Nasdaq (RNW, RNWWW), providing decarbonization solutions through a mix of green hydrogen, intelligent (data–driven) solutions, energy storage, manufacturing, and carbon markets. ReNew operates more than 150 utility-scale projects across 10 states in India. ReNew is committed to leading India’s energy transition and has a green energy portfolio of about ~17.4 GW, making it one of the largest globally.
You can access the full Integrated Report as a downloadable PDF from our microsite ______________.
We align our report with global frameworks such as the
Our Double Materiality assessment explains how our sustainability initiatives influence the company's financial performance (financial materiality) and how the company's operations impact society and the environment (impact materiality).
Highlights include clean energy generation, infrastructure development, solar modules manufacturing, new renewable energy project launches, emissions reduction milestones, social impact initiatives, awards, and sustainability rankings.
Investors, analysts, journalists, partners, policymakers, students, and anyone interested in renewable energy and sustainability in India will benefit from our report.
For further queries, please reach out to us at sustainability@renew.com