S&P Global Corporate Sustainability Assessment (CSA)



Decarbonising
Value Chains to Deliver
Climate Value at Scale
Responsible Innovations for a
Sustainable Tomorrow
Annual Integrated Report
Our progress, beyond boundaries.
Our strategic priorities advanced with strong progress and resilience, delivering consistent results across operations, sustainability, and financial performance.
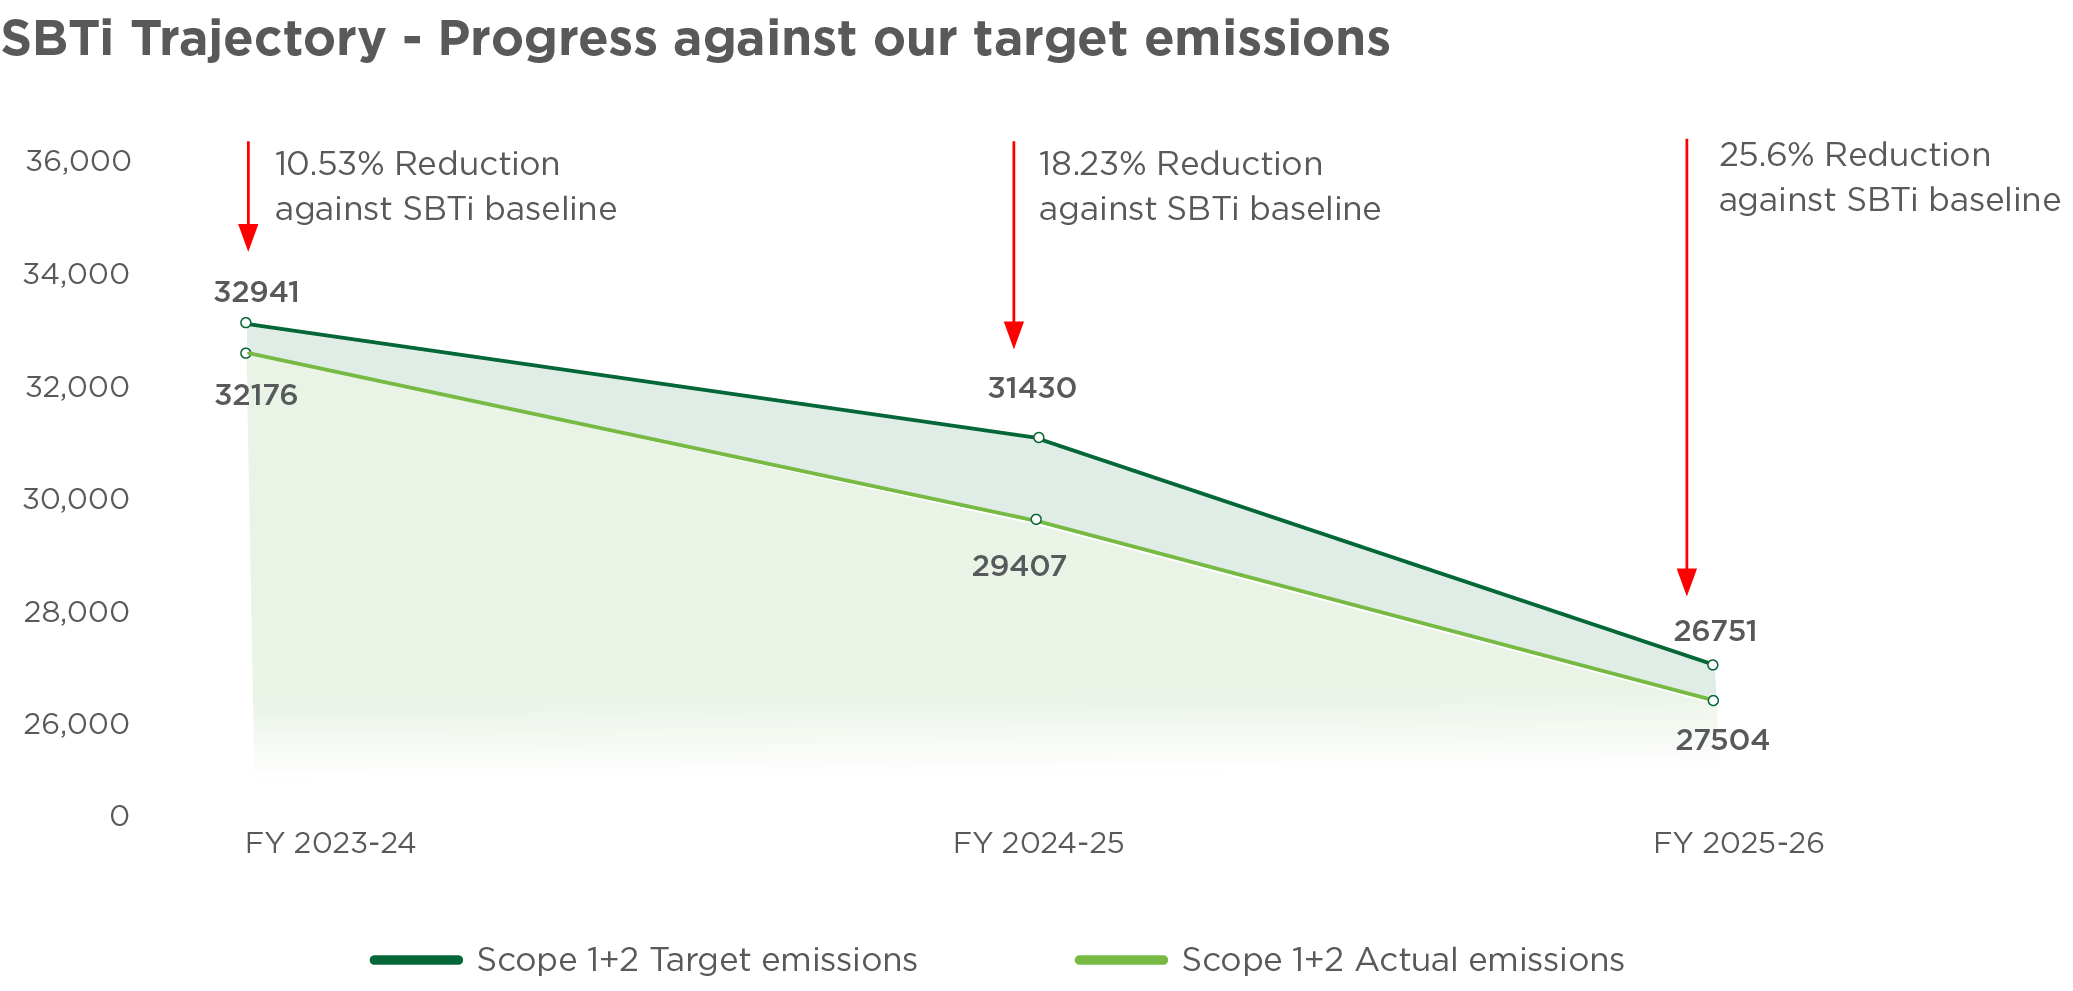
Underscores our commitment to climate action, resource efficiency, and responsible environmental stewardship across our operations.

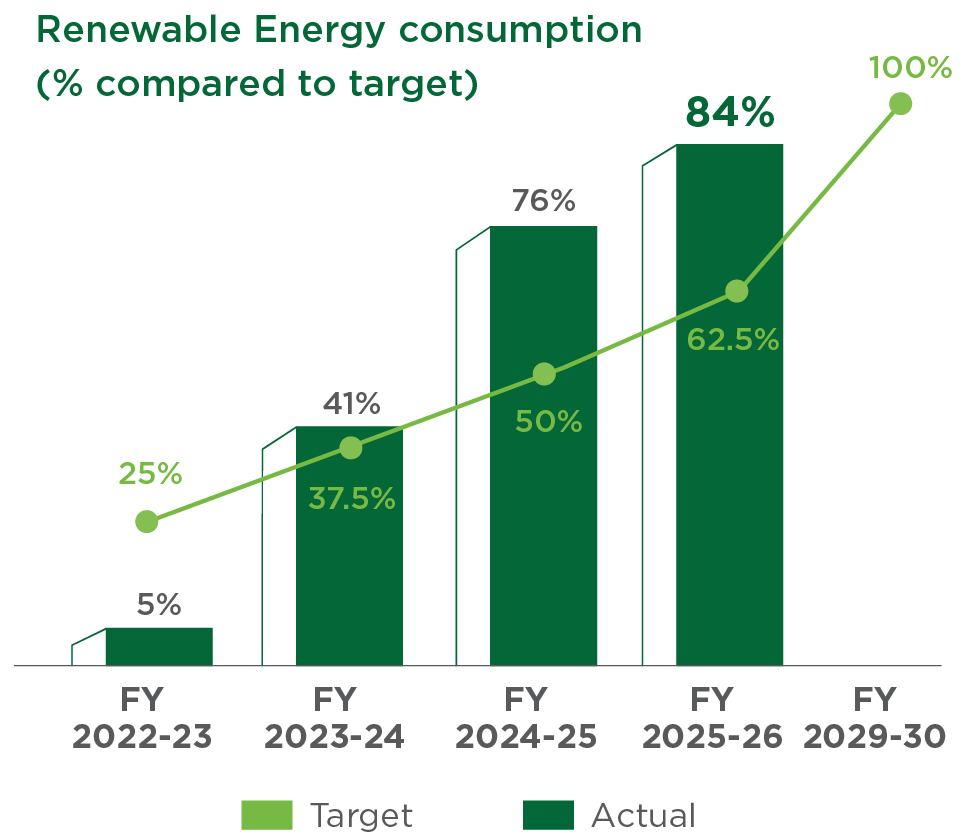
84%
electricity sourced
from
renewables
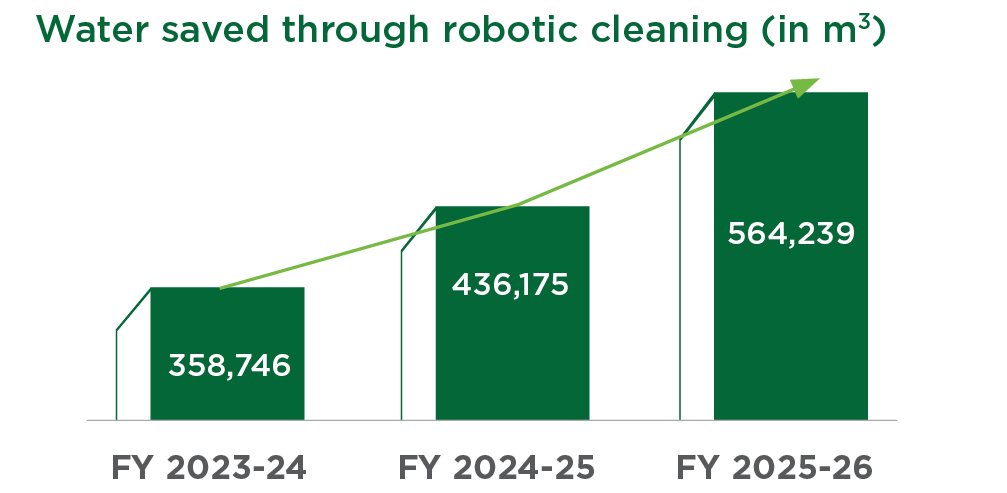
564,267m3
Water saved through
robotic cleaning
25.6%
Reduction in Scope 1 and Scope 2 emissions
100%
Zero Liquid Discharge (ZLD) across operations
20.8 million
tCO2e
Emissions avoided
*Graph Available
Reflects our focus on people, safety, inclusion, wellbeing, and community development.

*Graph Available
Demonstrates our commitment to ethical conduct, accountability, transparency, and strong oversight.

9
dedicated
Manufacturing
ESG
targets institutionalised
~39%
weighted average Board
gender diversity*
10%
ESG-linked CEO remuneration
98%
average Board meeting
attendance
55%
Independent directors
on
the Board
Zero
material fines,
penalties,
and convictions
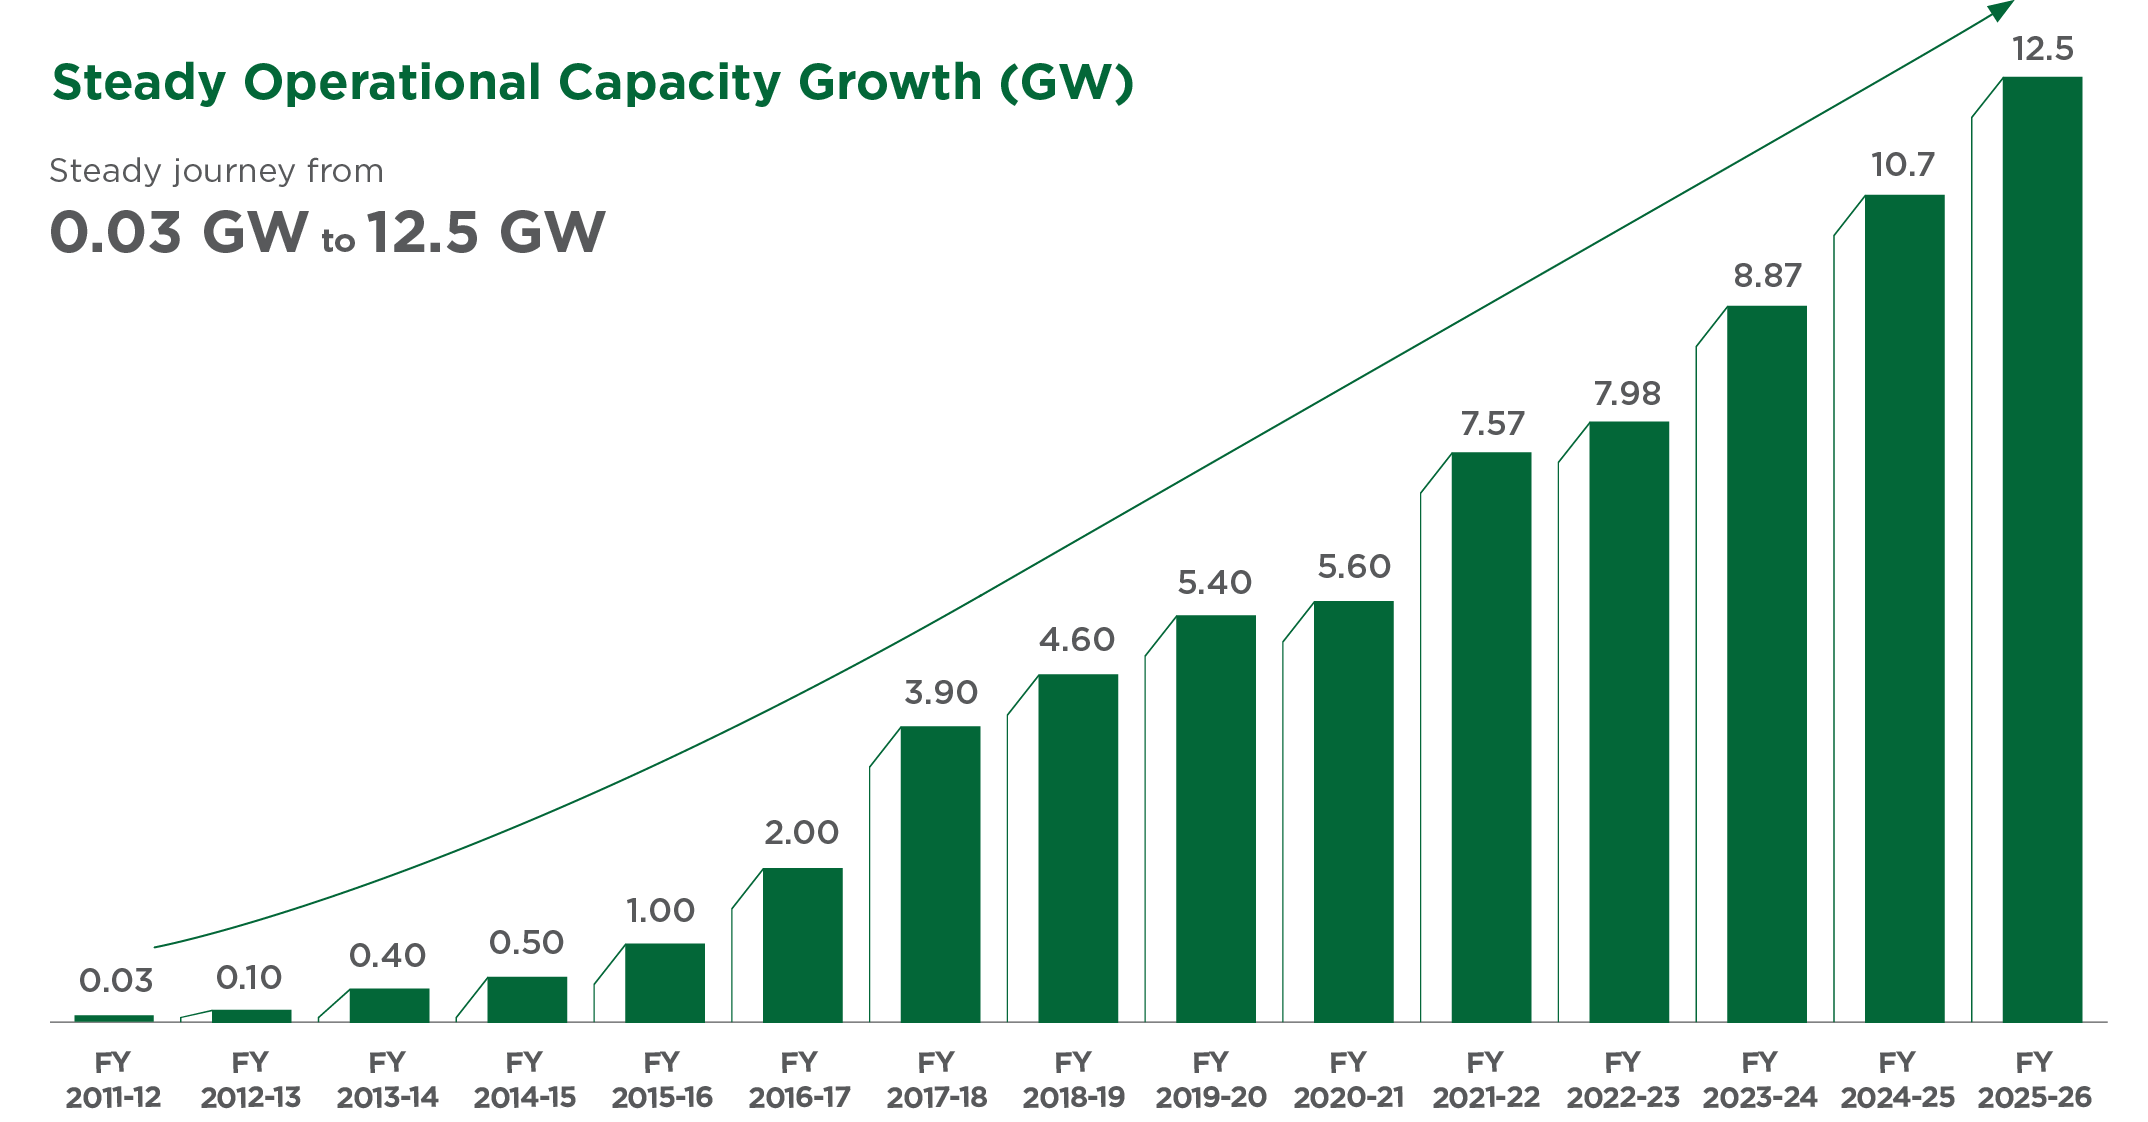
Highlights our industry leadership through a diversified renewable energy portfolio, spanning solar, wind, hydro, and energy storage – supported by a rapidly expanding, fully integrated manufacturing ecosystem.

12.5 GW
operational capacity across solar, wind and hydro
24.7 billion
units of clean energy generated
21.2 million
households annually powered with clean energy
6.4 GW
solar module manufacturing capacity
6.5 GW
solar ingot-wafer manufacturing facility under construction
2.5 GW
solar cell manufacturing capacity
4.0 GW
TopCon under construction
*Graph Available
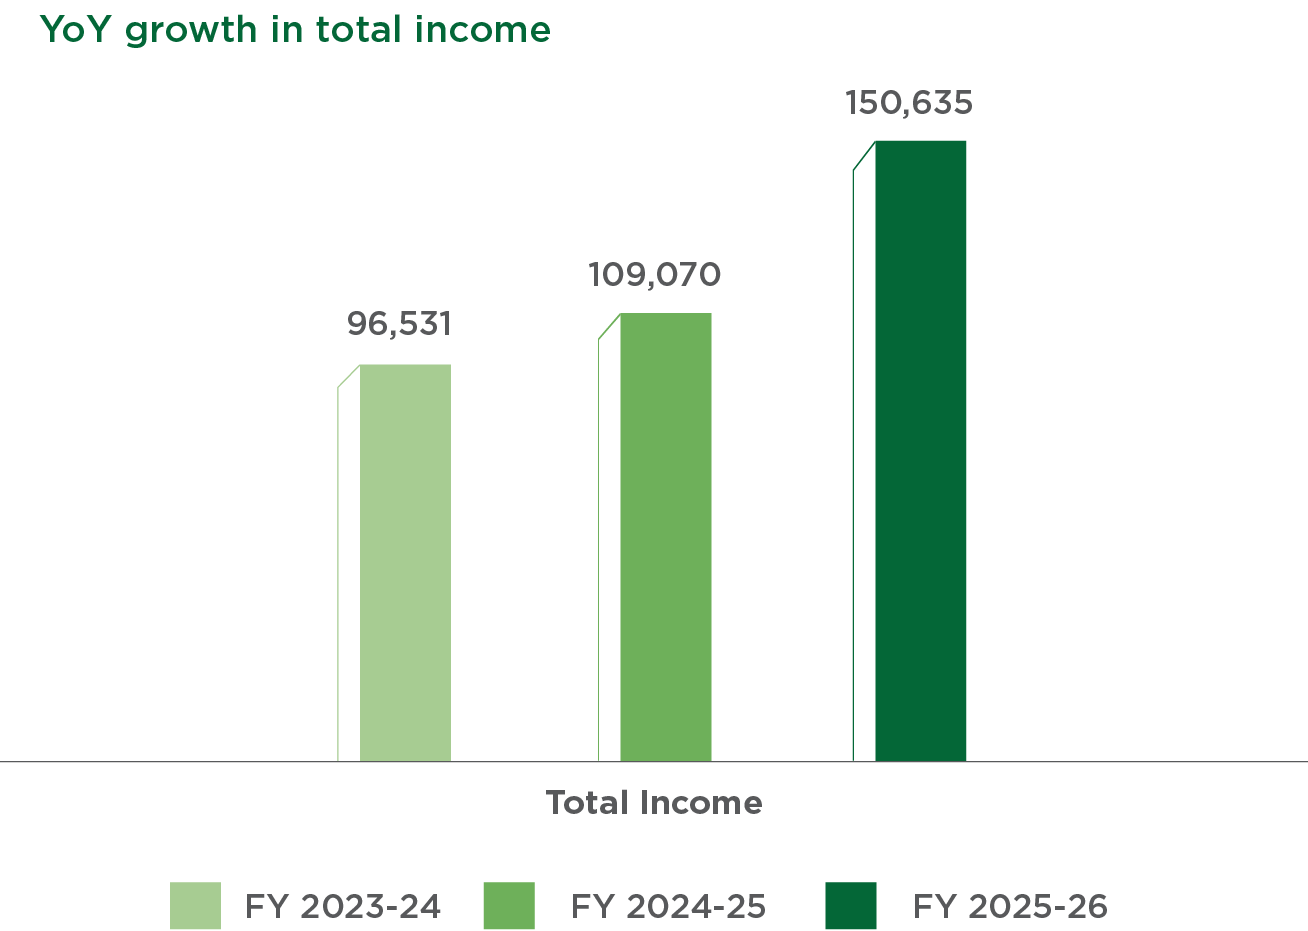
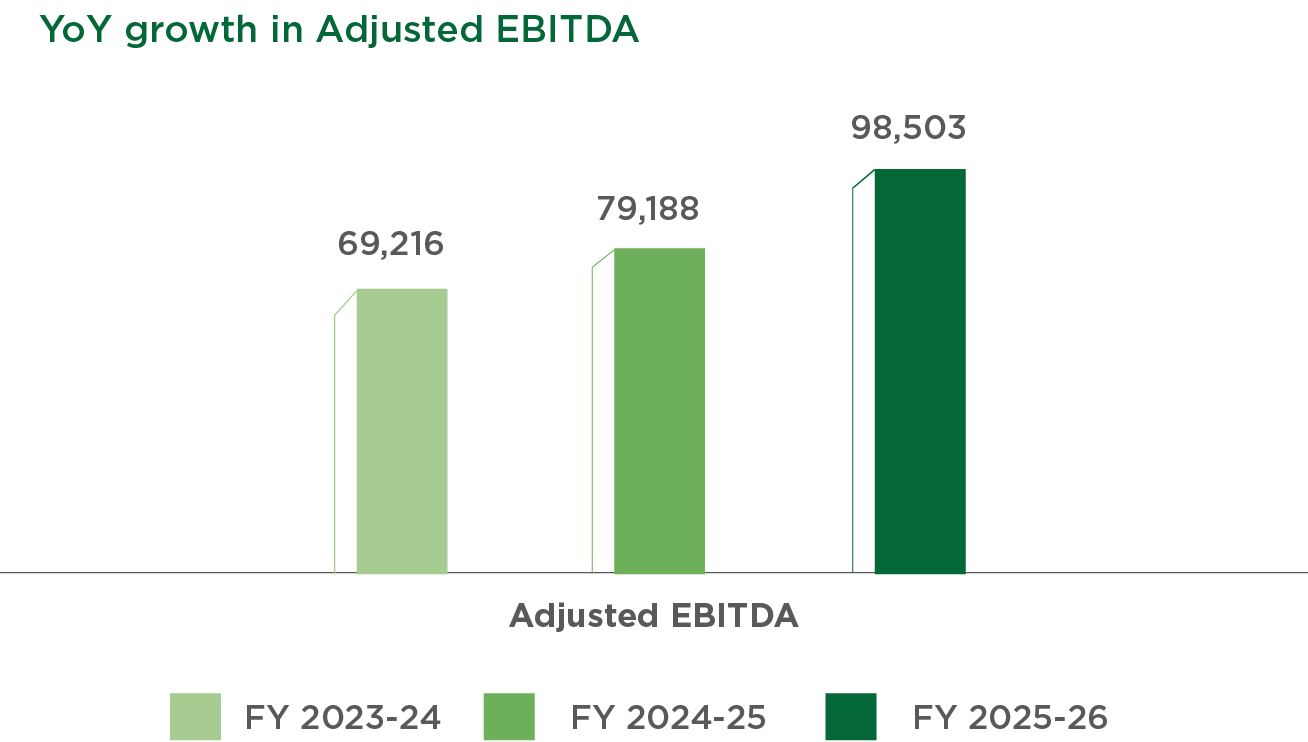
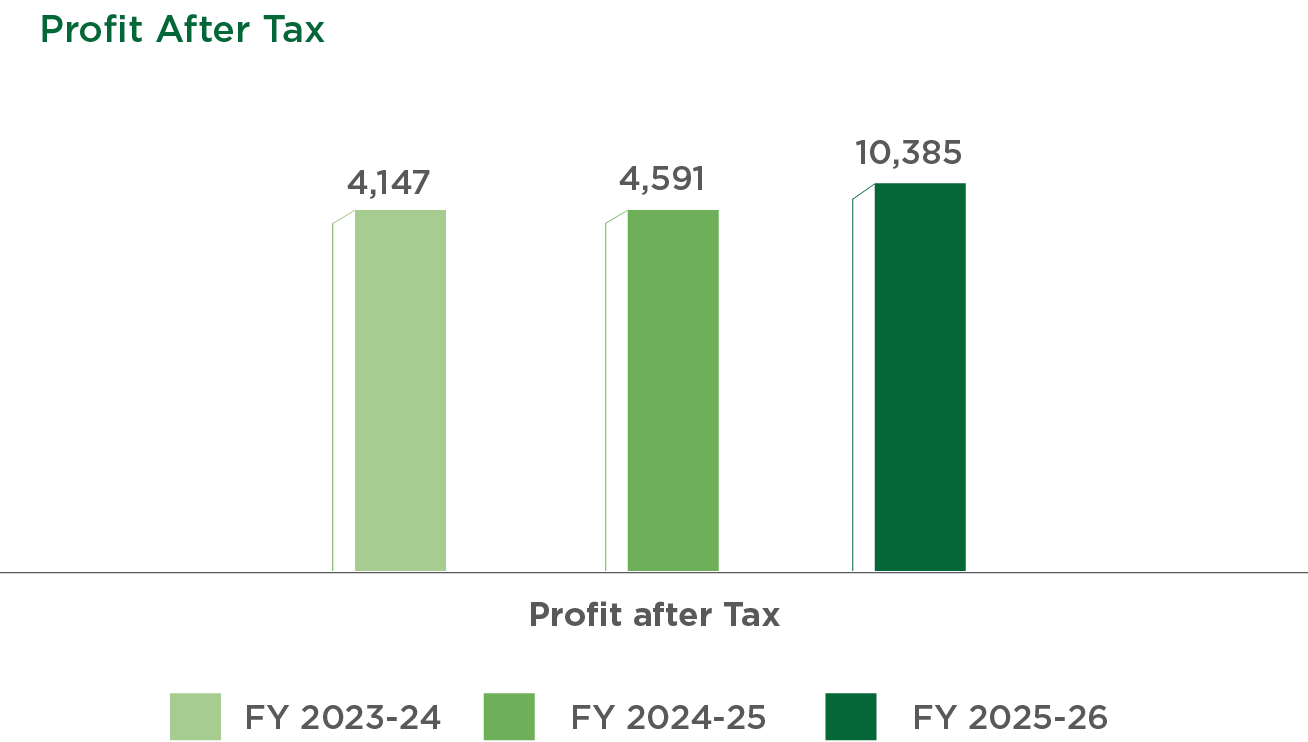
Reflects the strength of our business model, disciplined capital allocation, and ability to deliver profitable growth while maintaining a strong balance sheet.

38%
YoY growth in total income to INR 150.6 billion
24%
YoY growth in Adjusted EBITDA to INR 98.5 billion
23%
YoY increase in operating cash flow to INR 82.8 billion
6.4 GW
solar module manufacturing capacity
INR 10.4
billion
Profit After Tax more than doubled than last year
USD 600 million
Raised through India's first GIFT City Green Bond
*Graph Available




Dear Stakeholders,
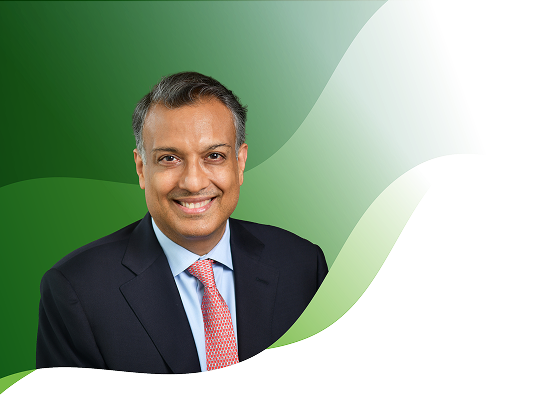
I am pleased to present ReNew’s Annual Integrated Report for FY 2025-26, a year that saw meaningful progress in our business, deeper integration across the clean energy value chain, and a deliberate execution of our strategic diversification as we advance our Purpose of building a carbon-free world.
Dear Stakeholders,
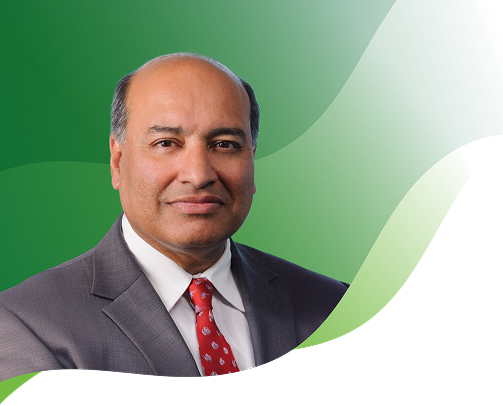
The global energy transition has entered a decisive decade. As economies seek to translate climate ambition into measurable outcomes, businesses have an increasingly important role in driving sustainable growth, strengthening resilience and creating long-term value.

Dear Stakeholders,
Our Annual Integrated Report FY 2025-26 comes at
a time when the energy transition continues to evolve
across global, national and business landscapes. The
pages ahead reflect a year of progress pursued with
both ambition and intent, as we remained committed
to deepening our purpose, refining our strategy,

As the global energy landscape evolves, our financial strategy remains anchored on disciplined capital allocation and sustainable growth. FY 2025-26 marked another year of strong execution, delivering our third consecutive year of profitability and the highest Profit After Tax in the company's history.

As global supply chains become more fragmented and strategic technologies increasingly shape economic power, countries are rethinking what it means to be competitive and resilient. For India, this imperative is reflected in the journey towards Viksit Bharat 2047
ReNew’s journey reflects more than a decade of ambition, resilience, and continuous evolution, moving from building renewable energy capacity to enabling climate solutions at scale.
ReNew’s international presence is anchored by strategically located offices across key global markets.
We are committed to a sustainable future and are actively shifting toward a low carbon economy. The company aims to achieve Net Zero emissions by 2040 which is 30 years ahead of India’s national target.
Scope 1 Total (Direct)
543
543 tCO2e
Scope 2 (Market Based)
Total (Indirect)
26,208
26,208 tCO2e
Scope 3 Total (Indirect)
3,698,020
3.7 million tCO2e
This resulted in the refresh of our organisation-wide ReSTART targets, with several goals extended through 2030 to support continued progress and long-term value creation
| PILLAR | Years | Target | MATERIAL TOPIC |
|---|---|---|---|
|
2028 | 5% reduction in waste generation intensity (tonnes/MW) for both cells and modules respectively from the FY 2025-26 baseline | Circular Economy and Waste Management |
| 2028 | 4% reduction in electricity consumption intensity (kWh/MW) for both cells and modules respectively from the FY 2025-26 baseline | Emissions and Energy Management | |
| 2028 | 5% reduction in water consumption intensity (m3/MW) for both cells and modules respectively from the FY 2025-26 baseline | Water Management | |
| 2030 | Achieve 10% recycled material content by weight in manufactured modules from the FY 2025-26 baseline | Circular Economy and Waste Management |
| PILLAR | Years | Target | MATERIAL TOPIC |
|---|---|---|---|

|
2030 | Inclusion of all-women select sections across manufacturing sites within 3 years of commissioning of respective site | Diversity and Inclusion |
| 2030 | Sustain conformance with BII 2X Challenge requirements on an annual basis | Diversity and Inclusion |
| PILLAR | Years | Target | MATERIAL TOPIC |
|---|---|---|---|

|
2030 | Increase R&D investment by 10% annually from the FY 2025-26 baseline | Innovation |
| 2030 | Climate risk assessment of all new manufacturing sites from the commissioning stage aligned with IFRS S2 | Risk Management |
| PILLAR | Years | TARGET | FY 2025-26 PROGRESS | MATERIAL TOPIC |
|---|---|---|---|---|
|
|
2027 | SBTi validated target of 29.4% reduction in absolute Scope 1, Scope 2 and Scope 3 GHG emissions (from FY 2021-22 baseline) | 25.6% reduction in Scope 1 and 2 GHG emissions from the baseline | Climate Change |
| 2030 | Get validated as carbon neutral (Scope 1 and 2) on an ongoing basis | Carbon Neutral for 6 continuous years across all sites | Climate Change | |
| 2030 | Source 100% of electricity through clean sources | 84% electricity sourced through clean sources | Emissions and Energy Management | |
| 2030 | Water-positive across all operations | Two sites (one wind and one solar) certified water positive. Initiated action plans to replicate progress across other sites | Water Management | |
| 2030 | All sites commissioned from baseline year FY 2025-26 to include 100% robotic cleaning | Coverage extended to 24 operational sites | Water Management | |
| 2030 | Zero solid-waste-to-landfill across all operations | Zero waste to landfill assessment in progress for all sites; >99% verified waste diversion achieved across manufacturing sites | Circular Economy & Waste Management | |
| 2030 | Planting 1 million trees under WEF’s 1t.org initiative | 90,949 trees planted till date | Biodiversity Conservation | |
| 2030 | Delivering on our commitment to No Net Loss, Net Positive Impact and No Net Deforestation | TNFD-aligned biodiversity risk assessment conducted across all sites | Biodiversity Conservation | |
| 2040 | SBTi validated target of 90% reduction in absolute Scope 1, Scope 2 and Scope 3 GHG emissions (from FY 2021-22 baseline) | 25.6% reduction in Scope 1 and 2 GHG emissions from the baseline | Climate Change |
| PILLAR | Years | TARGET | FY 2025-26 PROGRESS | MATERIAL TOPIC |
|---|---|---|---|---|
|
|
2030 | Sustain an LTIFR below 0.20 on a three-years rolling basis | 0.10 LTIFR recorded across the workforce | Health and Safety |
| 2030 | 100% awareness of ESG among all employees | 97% employees sensitised on ESG matters | Employee Engagement and Development | |
| 2030 | 100% of employees, workers and contractors to receive training on human rights, business ethics and corruption | 100% security workforce trained on Human Rights | Human Rights; Business Ethics | |
| 2030 | 100% human rights due diligence coverage across critical and high-risk suppliers, with zero confirmed human rights violations across operations and supply chain | Zero complaints on human rights violations reported | Human Rights; Labour Management; Sustainable Supply Chain | |
| 2030 | ESG risk assessment for 100% critical suppliers, with renewal every 3 years for active suppliers | 100% critical suppliers assessed for ESG risk for three consecutive years; 100% ESG screening for onboarding new critical suppliers | Sustainable Supply Chain | |
| 2030 | SBTi-aligned Net Zero targets for 20% critical suppliers | 41% critical suppliers have SBTi-aligned Net Zero targets | Sustainable Supply Chain | |
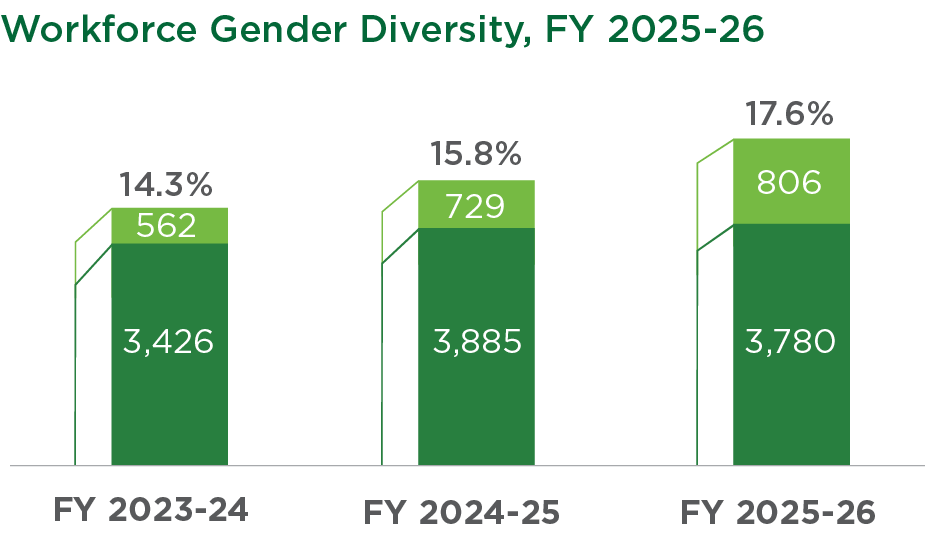
| 2030 | 30% women in the workforce | ~18% women in the workforce | Diversity and Inclusion | |
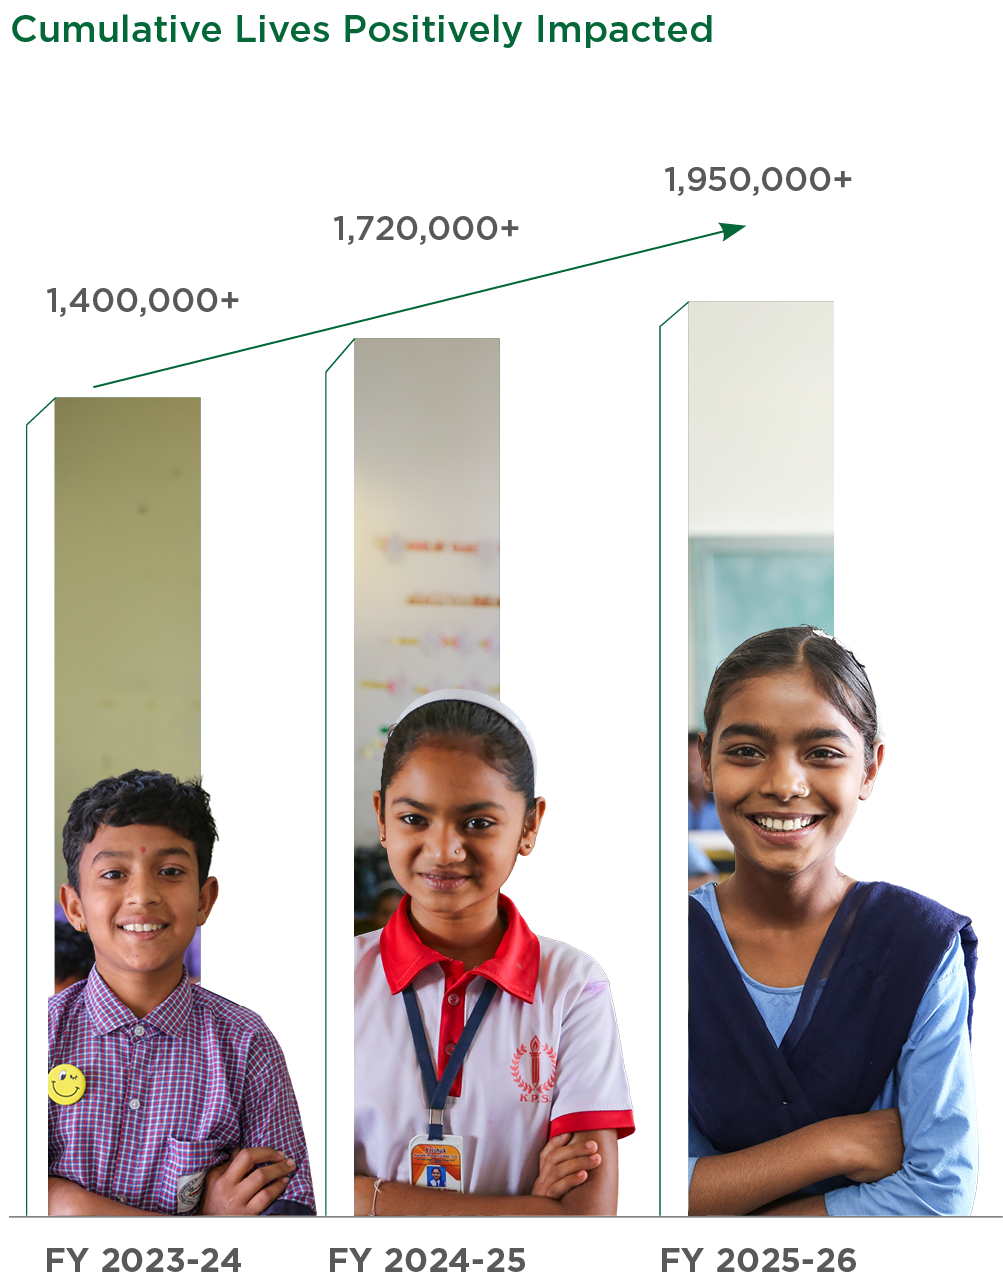
| 2030 | Positively impact 2.5 million people through CSR initiatives | 1.95+ million lives positively impacted cumulatively till FY 2025-26 across 14 Indian states | Community Engagement | |
| 2030 | Advocate to enable India as a fully integrated Domestic Solar Manufacturing Hub | Strengthened India's solar manufacturing ecosystem through targeted policy engagement on ALMM implementation | Policy Advocacy and Thought Leadership | |
| 2030 | Drive climate advocacy through active engagement in 5 global climate platforms, aligned with the 1.5°C Paris Agreement ambition | Active engagement in 5+ global climate platforms, aligned with the 1.5°C Paris Agreement ambition | Policy Advocacy and Thought Leadership |
| PILLAR | Years | TARGET | FY 2025-26 PROGRESS | MATERIAL TOPIC |
|---|---|---|---|---|
|
|
2030 | Maintain yield improvement up to 1% annually through digital use cases implemented for wind and solar portfolio | 1-1.5% yield improvement for our wind and solar portfolio | Innovation |
| 2030 | Board diversity for 30% female representation | 22% women representation at Board level | Diversity and Inclusion | |
| 2030 | Zero instances of anticompetitive behaviour, anti-trust, and monopolistic practices | Compliance protocols in place; continued monitoring in progres | Business Ethics; Compliance Management |
|
| 2030 | Link ESG performance with executive compensation | ESG-linked KPIs embedded into executive evaluation and remuneration structure | Business Ethics; Compliance Management |
|
| 2030 | Embed ESG risks in the ERM framework with mitigation plans for all identified risks | ESG risks mapped under ERM; mitigation e"orts ongoing | Risk Management | |
| 2030 | Complete climate risk assessment for 100% of operational sites aligned with IFRS S2 | IFRS S2-aligned climate Risk Assessment completed for all operational sites | Risk Management | |
| 2030 | Build cyber-resilient and privacy-by-design digital operations across IT, OT, AI and third-party ecosystems | Responsible AI policy developed; Zero data security breaches |
Cybersecurity and Data Privacy | |
| 2030 | Rank among Top 5 globally in Energy and Utilities (CDP, S&P Global CSA, Sustainalytics, Refinitiv, MSCI) | Enhanced ESG ratings across various ratings indices | Policy Advocacy and Thought Leadership |
The DMA process identified and prioritised 18 material topics across three ESG pillars:
List of material topics
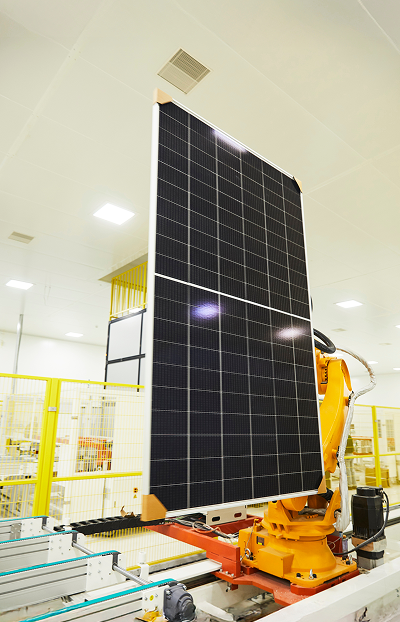
Our 12.6 GW of commissioned capacity, generates 24.7 billion units of electricity, mitigating ~20.8 million tonnes of CO2e annually
Advancing recycling R&D e"orts in manufacturing to recover silicon, glass, aluminium, and critical metals from end-of-life solar modules and batteries, eliminating virgin material extraction
Targeting 5% reduction in water intensity (m3/MW) for both cell and module by 2030, decoupling manufacturing scale from water consumption.
Over 1500 employment opportunities created in the last year with ~52% of new hires in manufacturing, while advancing inclusion through a women-led production line with 77 women deployed across shifts.
1.0-1.5% annual yield improvement reported through AI-driven energy yield optimisation across ./resources/ir/ir2526/assets.
Maximised infrastructure uptime and performance by leveraging predictive maintenance, drone inspections and real-time asset monitoring technologies.
INR 88.2 billion revenue reported from clean energy generation, marking an 8% YoY increase.
INR 40.8 billion revenue from external sales in manufacturing, accounting for 31% of total revenue.
Maintained 100% Zero Liquid Discharge across operations, with all treated water reused on-site and 2 sites certified as water positive.
Diverted over 99% of manufacturing waste from landfill, with ~13,835 MT of waste assessed across Jaipur (3,926 MT) and Dholera (9,909 MT).
25.6% reduction in Scope 1 and 2 emissions against baseline, keeping ReNew ahead of its SBTi-aligned decarbonisation pathway.

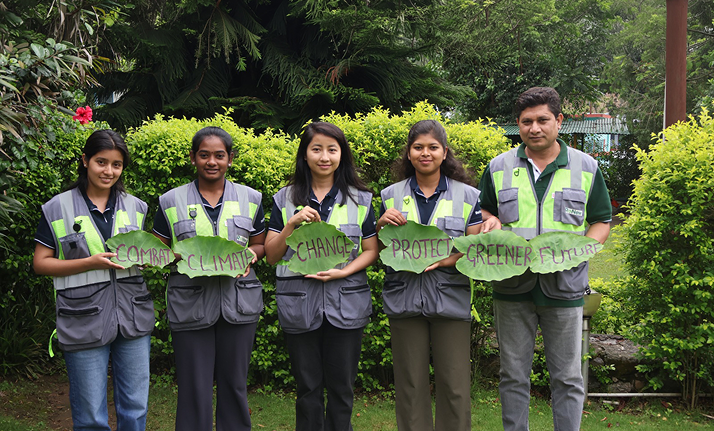
Mobilised 24 sustainability and climate champions to accelerate grassroots sustainability action across business units.
ESG Impact Awards drove sustainability ownership across 150+ sites, recognising 40+ employees, SPOCs and Climate Champions for measurable contributions in sustainability
Advancing technical capabilities in material recovery, PV recycling, battery recycling and next-generation solar technologies, building proprietary knowledge to support innovation and circularity across the clean energy value chain.
Enhanced energy productivity through manufacturing process optimisation (Jaipur laminator optimisation initiative), saving 142 MWh of electricity and ~INR 1.1 million annually.
Supported operational excellence through a world-class safety culture, delivering a 52% YoY reduction in LTIFR and zero fatalities.
31% increase in employee e!ciency at wind sites through Automated Reporting Systems, streamlining data management, reducing manual e"ort, and enabling faster operational decision-making.
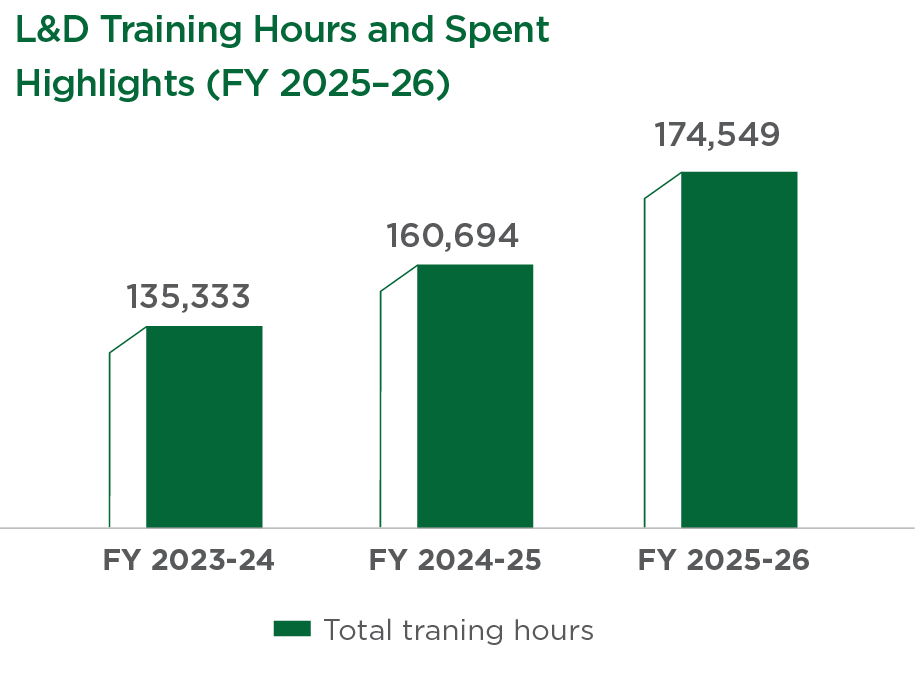
Built workforce capabilities to support ReNew’s clean energy, manufacturing and decarbonisation ambitions.
Developed ESG compliance training and awareness programs across the workforce, along with conservation engagements; 97% employees sensitised on ESG matters.
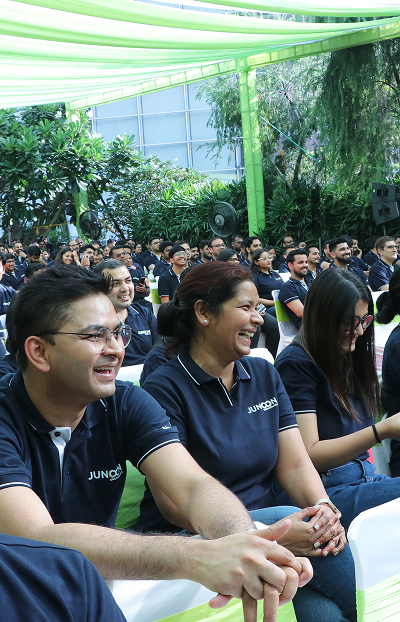
3,500+ employees trained through R.AI.SE, a fiveday enterprise-wide programme designed to build AI fluency and reinforce responsible AI adoption.
Expanded organisational knowledge through ReNew Academy, iLearn and VR-based learning programmes.
INR 5.5 million invested in employee well-being and engagement initiatives, enhancing workforce engagement, wellness, and retention.
Strengthened clean energy delivery through 2.7 GW dedicated C&I capacity and long-term customer partnerships.
Dedicated customer engagement channels to facilitate support requests and feedback, including AI enabled chatbots, online portals and forms, dedicated support email addresses and customer helplines.
Reduced emissions through blended cement use in WTG foundations, avoiding 5.79 tonnes of CO2 emissions.
Re-utilised ~41,000 kg of packaging material and promoted circularity across operations.
Advanced climate awareness through the Young Climate Leadership Curriculum, fostering environmental stewardship among future generations.
100% domestic sourcing of steel for wind tower plates and 14% procurement from MSMEs fostered inclusive economic growth across communities and industries.
Enabled green-skilling opportunities through initiatives such as Project Surya, which trained 728 women as solar technicians.
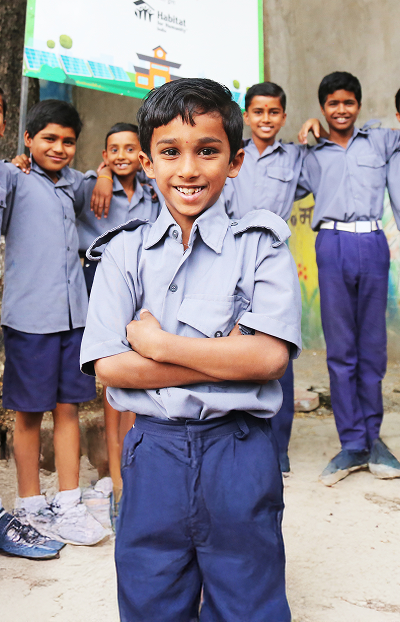
3 innovative enterprises felicitated through ReNew ACE programme and 6,624 students upskilled part of Young Climate Leadership Curriculum (YCLC) initiative.
Fostered knowledge sharing through the UN Global Compact Coalition for Sustainable Procurement and cross-sector collaboration platforms.
Strengthened supply chain resilience through 25.21% local procurement spend.
Generated INR 14.1 billion C&I revenue, reporting 22% YoY growth.
Improved procurement e!ciency through 100% digital PO issuance and invoice digitalisation.
Enabled 1–1.5% annual yield improvement through AI-driven energy yield optimisation across renewable energy ./resources/ir/ir2526/assets.
26% reduction in asset downtime enabled through real-time monitoring and predictive maintenance across wind ./resources/ir/ir2526/assets.
Robotic cleaning programme, now extended to additional sites, saves over 564,239 m3 annually, replacing manual water-based panel cleaning at scale.
INR 3.5 million invested in technology-adoption training to enhance workforce capabilities, and support the integration of advanced technologies across operations.
66% increase in trading-team productivity enabled by Sakshaat - Energy Trading Intelligence.
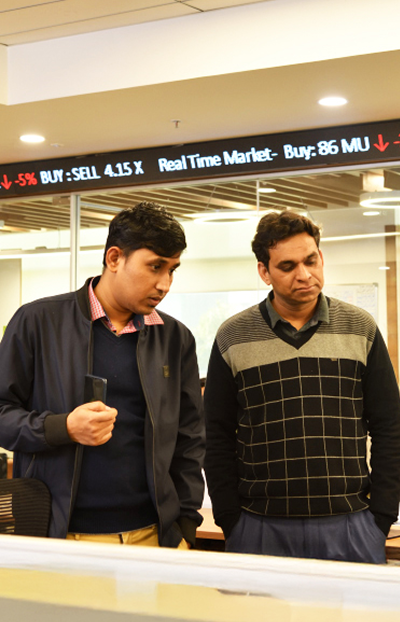
Delivered INR 100 million in incremental revenue and cost savings through precision-led scheduling and dispatch optimisation.
INR 42 billion invested to establish 6.5 GW solar Ingot-Wafer manufacturing facility in Anakapalli district near Visakhapatnam, Andhra Pradesh.
Deployed INR 779.3 billion of capex during FY 2025-26 to expand our IPP and manufacturing infrastructure.
Reduced GST resulted into direct savings of up to INR 1-1.5 million per MW for utility-scale projects.
Invested INR 2.7 million in FY 2025–26 towards waste management activities, supporting responsible disposal leading to a 25% decrease from FY 2024-25 to 5,228 tonnes in FY 2025-26
INR 11.64 million in cost savings realised through renewable energy integration across sites.
INR 180 million proposed investment in 1.5 years in next-generation solar technologies and circularity solutions.
INR 5.5 million investment in employee well-being and engagement initiatives reflecting continued investment in talent, capability development and workforce wellbeing.
INR 91.1 million investment in employee learning and development programs, build a future-ready skilled workforce.
Invested INR 275.5 million in digital transformation.
INR 24 million invested in research and development to strengthen innovation-led growth.


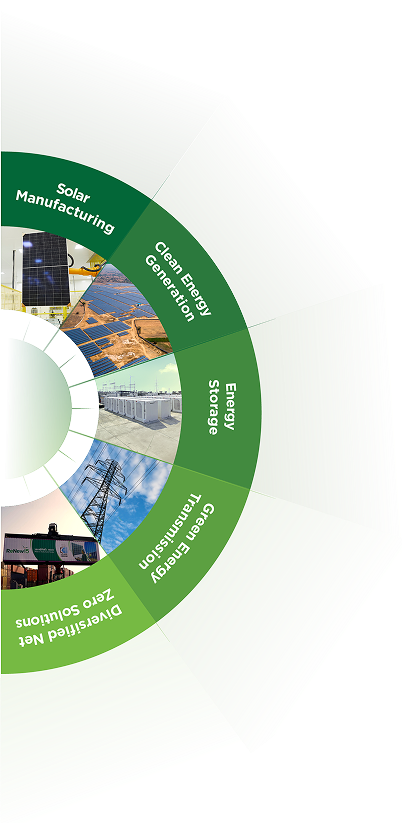

Communities
Investors
Customers &
Government
Agencies
Communities
Employees
Suppliers
Investors
Employees
Investors
Communities
Customers
Suppliers
Employees
Investors
Industry Associations &
Government Agencies
Investors
Shareholders

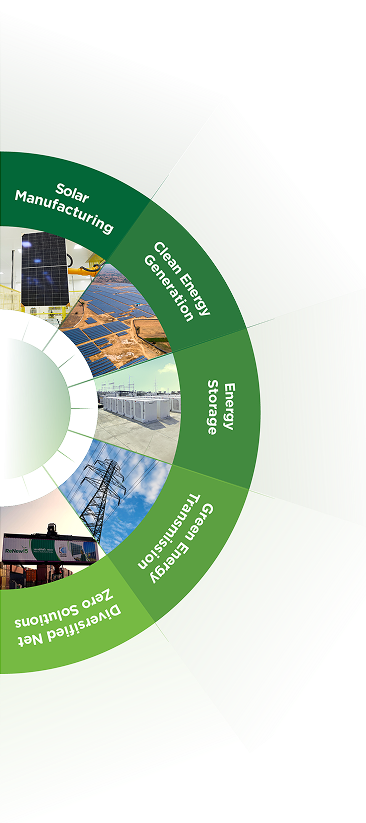
Communities
Investors
Customers &
Government
Agencies
Communities
Employees
Suppliers
Investors
Employees
Investors
Communities
Customers
Suppliers
Employees
Investors
Industry Associations &
Government Agencies
Investors
Shareholders
84%
renewable
electricity
sourced
Carbon Neutral
for 6th consecutive
year
(Scope 1 and 2)
ZERO
environmental
non-compliance
617,167 m3
water saved
25.6%
scope 1 and 2 emissions reduction from FY 2021–22 SBTi baseline
100%
of operations assessed for Biodiversity-risk
4%
higher water
conservation
achieved than
target

98%
Average Board
Meeting
Attendance
46
Total Board &
Committee
Meetings
Internal
Board Evaluation
Completion
ZERO
Material Fines
&
Penalties
~39%
Board Weighted
Average
Gender Diversity*
5
Independent
Directors
~3 years
Average Board Tenure
10%
of CEO & Executive Leadership Variable Compensation Linked to ESG
8
Board Meetings Held
3.64 GW
clean energy managed through energy market operations
12.5 GW
renewable energy portfolio commissioned, with 5.8 GW capacity under development
1,500 MVA
transmission infrastructure
6.4 GW
solar module and 2.5 GW solar cell manufacturing capacity operational, with 6.5 GW ingot-wafer and 4 GW cell capacity under development
100 MW / 250 MWh
battery energy storage capacity commissioned
2.7 GW
commercial and industrial renewable energy solutions portfolio
24.4 million
carbon credits generated to date
1.1 MMTPA
green hydrogen opportunity and 15 GW pumped hydro storage pipeline
38%
YoY increase in total income to INR 150.6 billion
21%
YoY increase in cash from operations to INR 81.4 billion
USD 4.5 billion
mobilised through 10 green bond issuances till date
USD 1.1 billion
realised till date
through
asset recycling
97.6%
revenue is EU Taxonomy aligned
36%
YoY increase in Profit before Tax to INR 13.6 billion
USD 600 million
raised via India’s first GIFT City Green Bond
1.1x
improvement in Leverage
24%
YoY increase in Adjusted EBITDA to INR 98.5 billion
2.3x
growth in Profit After Tax to INR 10.4 billion
36%
YoY increase in revenue from operations to INR 132.2 billion, with INR 88.2 billion contributed by the sale of renewable energy
Explore answers to common questions about ReNew’s Annual Integrated Report, covering key highlights, ESG standards, reporting frameworks, and more.
An integrated report combines a company’s financial performance with non-financial data such as environmental, social, and governance (ESG) metrics to provide a holistic overview of value creation.
Integrated reporting allows stakeholders to understand how our company’s sustainable practices and business strategy create long-term value for investors, communities, and the environment.
Key metrics cover carbon emissions, renewable energy generation, resource efficiency, community projects, and progress on the United Nations Sustainable Development Goals (SDGs).
ReNew is a leading decarbonization solutions company listed on Nasdaq (RNW, RNWWW), providing decarbonization solutions through a mix of green hydrogen, intelligent (data–driven) solutions, energy storage, manufacturing, and carbon markets. ReNew operates more than 150 utility-scale projects across 10 states in India. ReNew is committed to leading India’s energy transition and has a green energy portfolio of about ~20.2 GW, making it one of the largest globally.
You can access the full Integrated Report as a downloadable PDF from our microsite.
We align our report with global frameworks such as the
Our Double Materiality assessment explains how our sustainability initiatives influence the company's financial performance (financial materiality) and how the company's operations impact society and the environment (impact materiality).
Highlights include clean energy generation, infrastructure development, solar modules manufacturing, new renewable energy project launches, emissions reduction milestones, social impact initiatives, awards, and sustainability rankings.
Investors, analysts, journalists, partners, policymakers, students, and anyone interested in renewable energy and sustainability in India will benefit from our report.
For further queries, please reach out to us at sustainability@renew.com
Enter your details below and we'll send the FY 2025-26 Integrated Report straight to your email.